Le metriche AWS CloudWatch a portata di sguardo.
Trasmetti dashboard, metriche e stati degli allarmi di AWS CloudWatch su schermi di segnaletica digitale per una visibilità continua dell'infrastruttura cloud.
Infrastruttura AWS su Ogni Schermo
AWS CloudWatch è la spina dorsale del monitoraggio per milioni di workload cloud. Hangar.Media visualizza i dashboard di CloudWatch su schermi di segnaletica digitale, offrendo al tuo team di infrastruttura una visibilità continua su utilizzo delle risorse, metriche di performance e stati degli allarmi. Mostra l'utilizzo della CPU di EC2, le connessioni RDS, le invocazioni Lambda e i dati di fatturazione su pareti NOC e display di engineering.
Cosa puoi fare con a portata di sguardo.
Tre funzionalità che rendono questa integrazione indispensabile per la tua rete di segnaletica digitale.
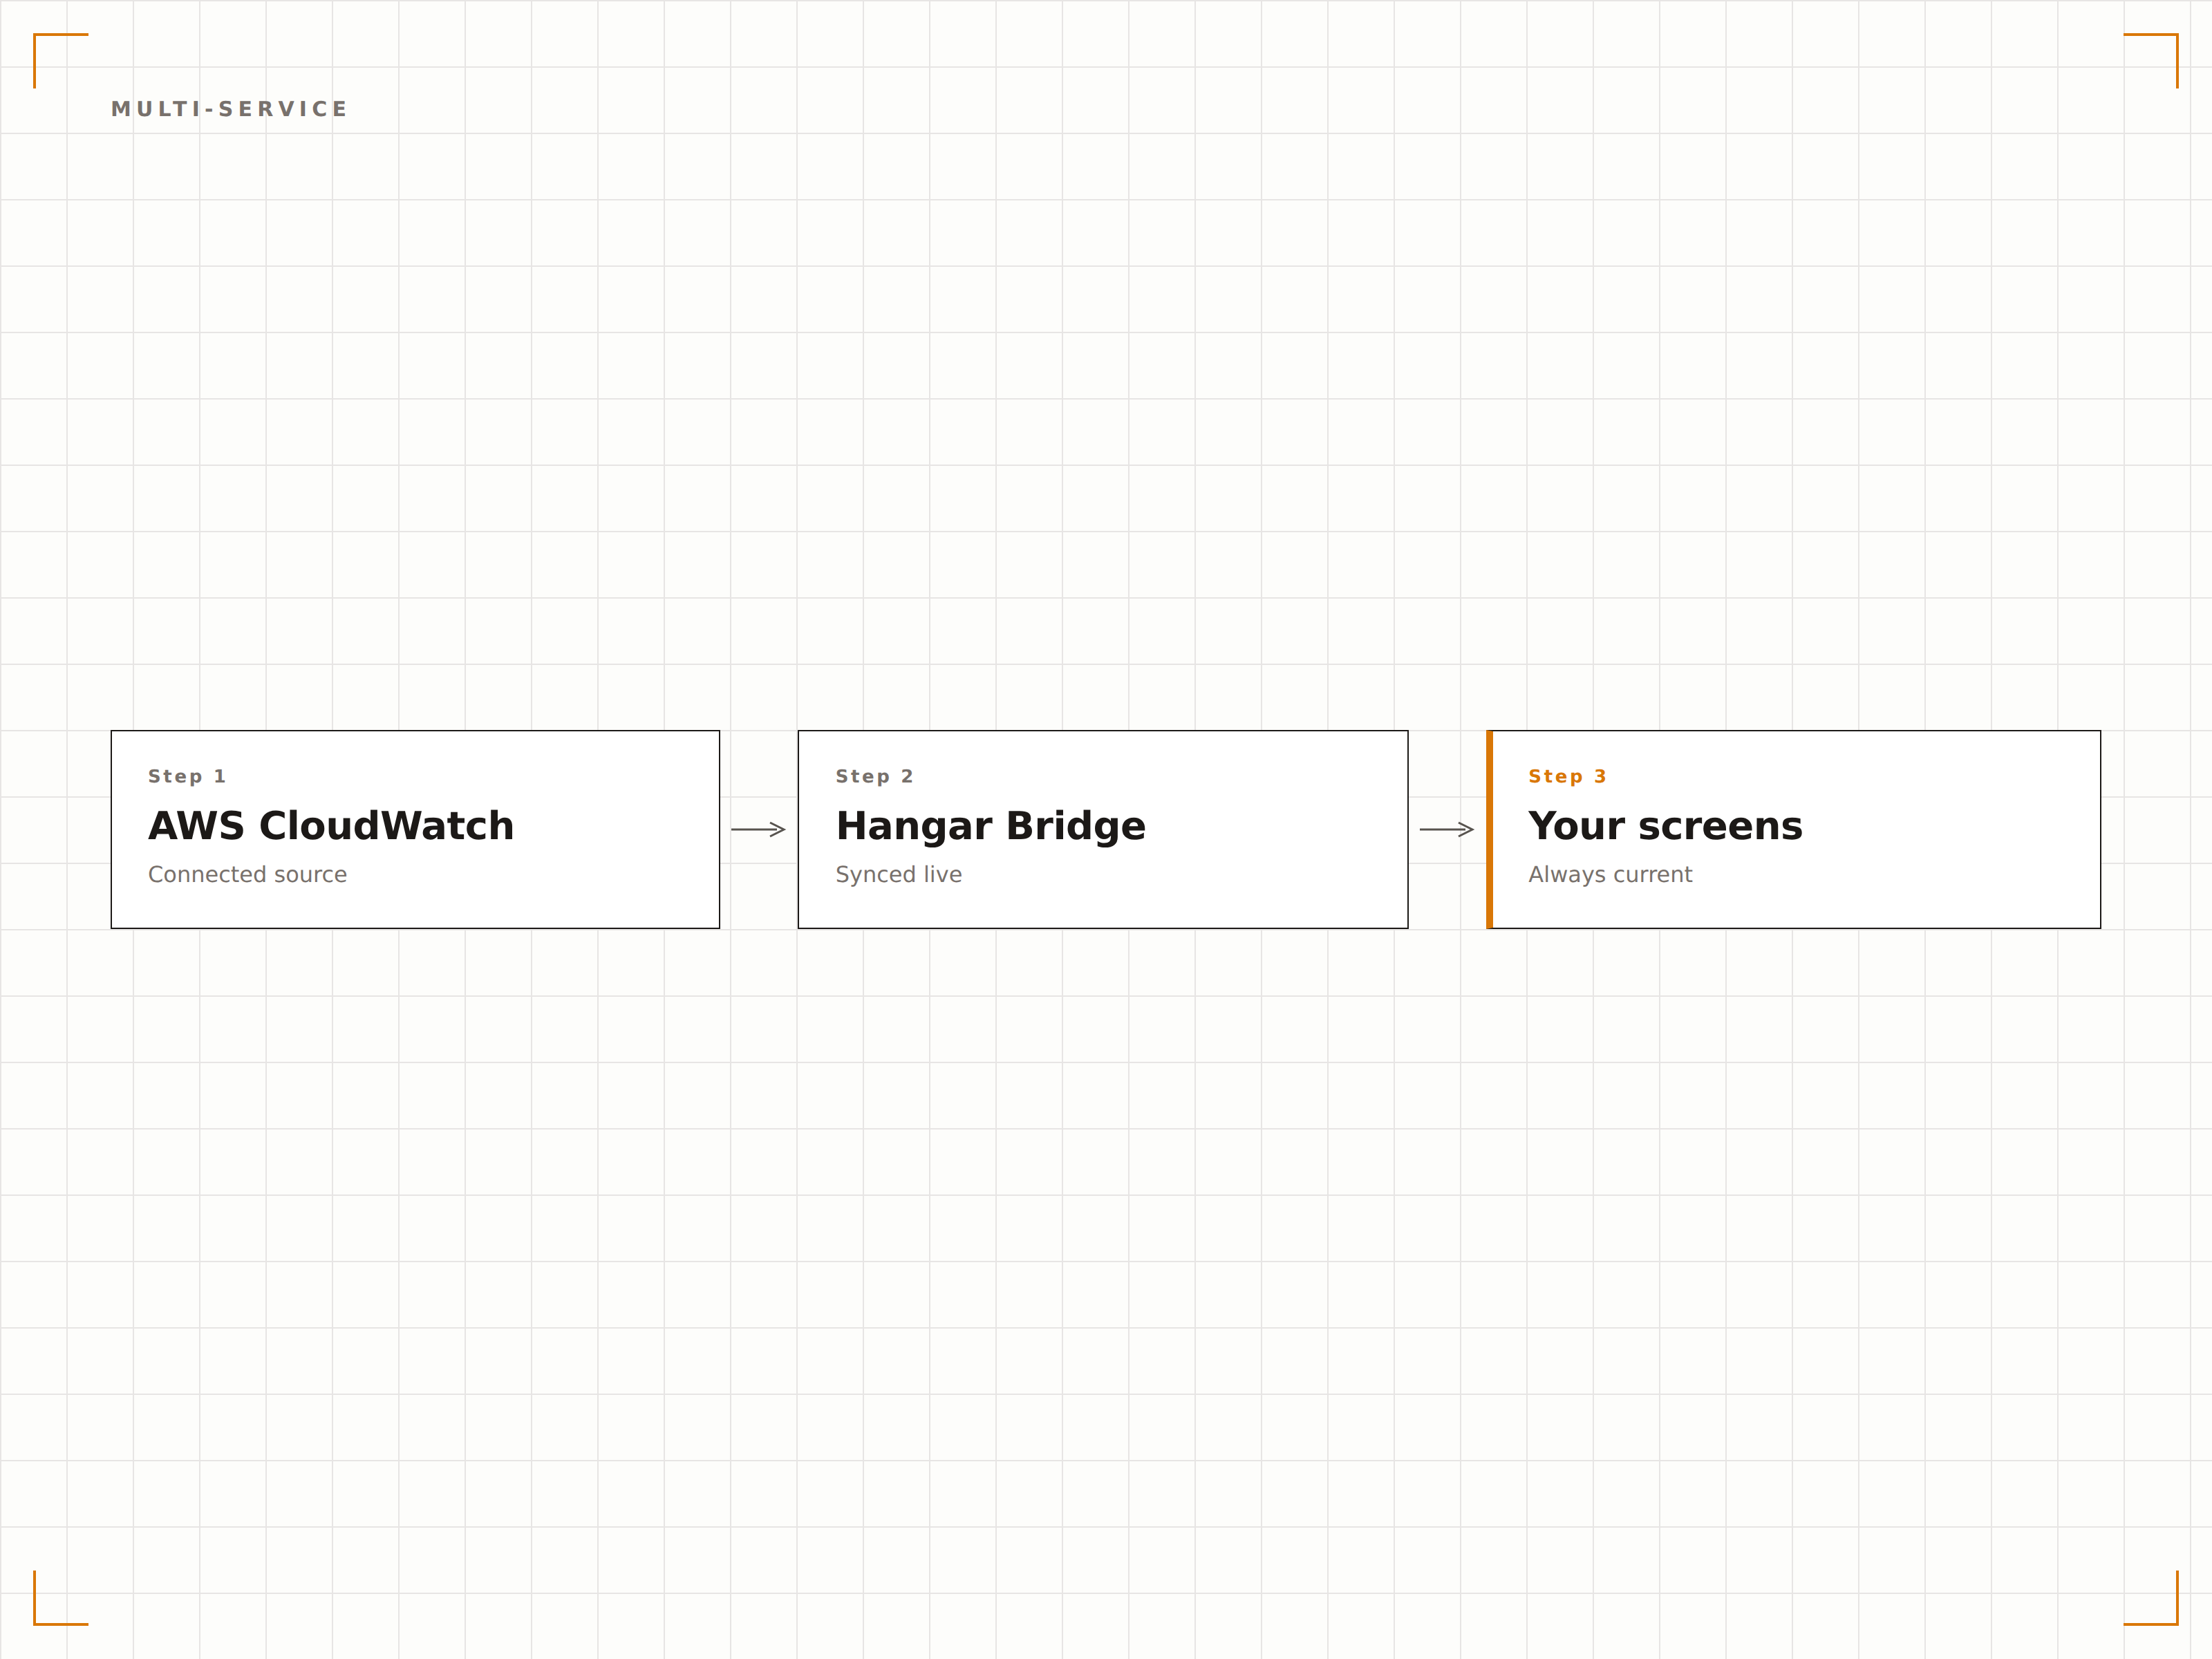
Tutti i Servizi AWS in un'Unica Vista
CloudWatch raccoglie metriche da oltre 70 servizi AWS. Visualizza dashboard composite su schermi di segnaletica digitale che combinano lo stato delle istanze EC2, le performance del database RDS, le metriche di esecuzione Lambda e l'utilizzo dello storage S3 in un'unica vista unificata.
L'intero patrimonio AWS, visibile su un unico schermo.
Metriche di EC2, RDS, Lambda e S3
Monitoraggio di ELB, API Gateway e SQS
Metriche personalizzate dalle tue applicazioni
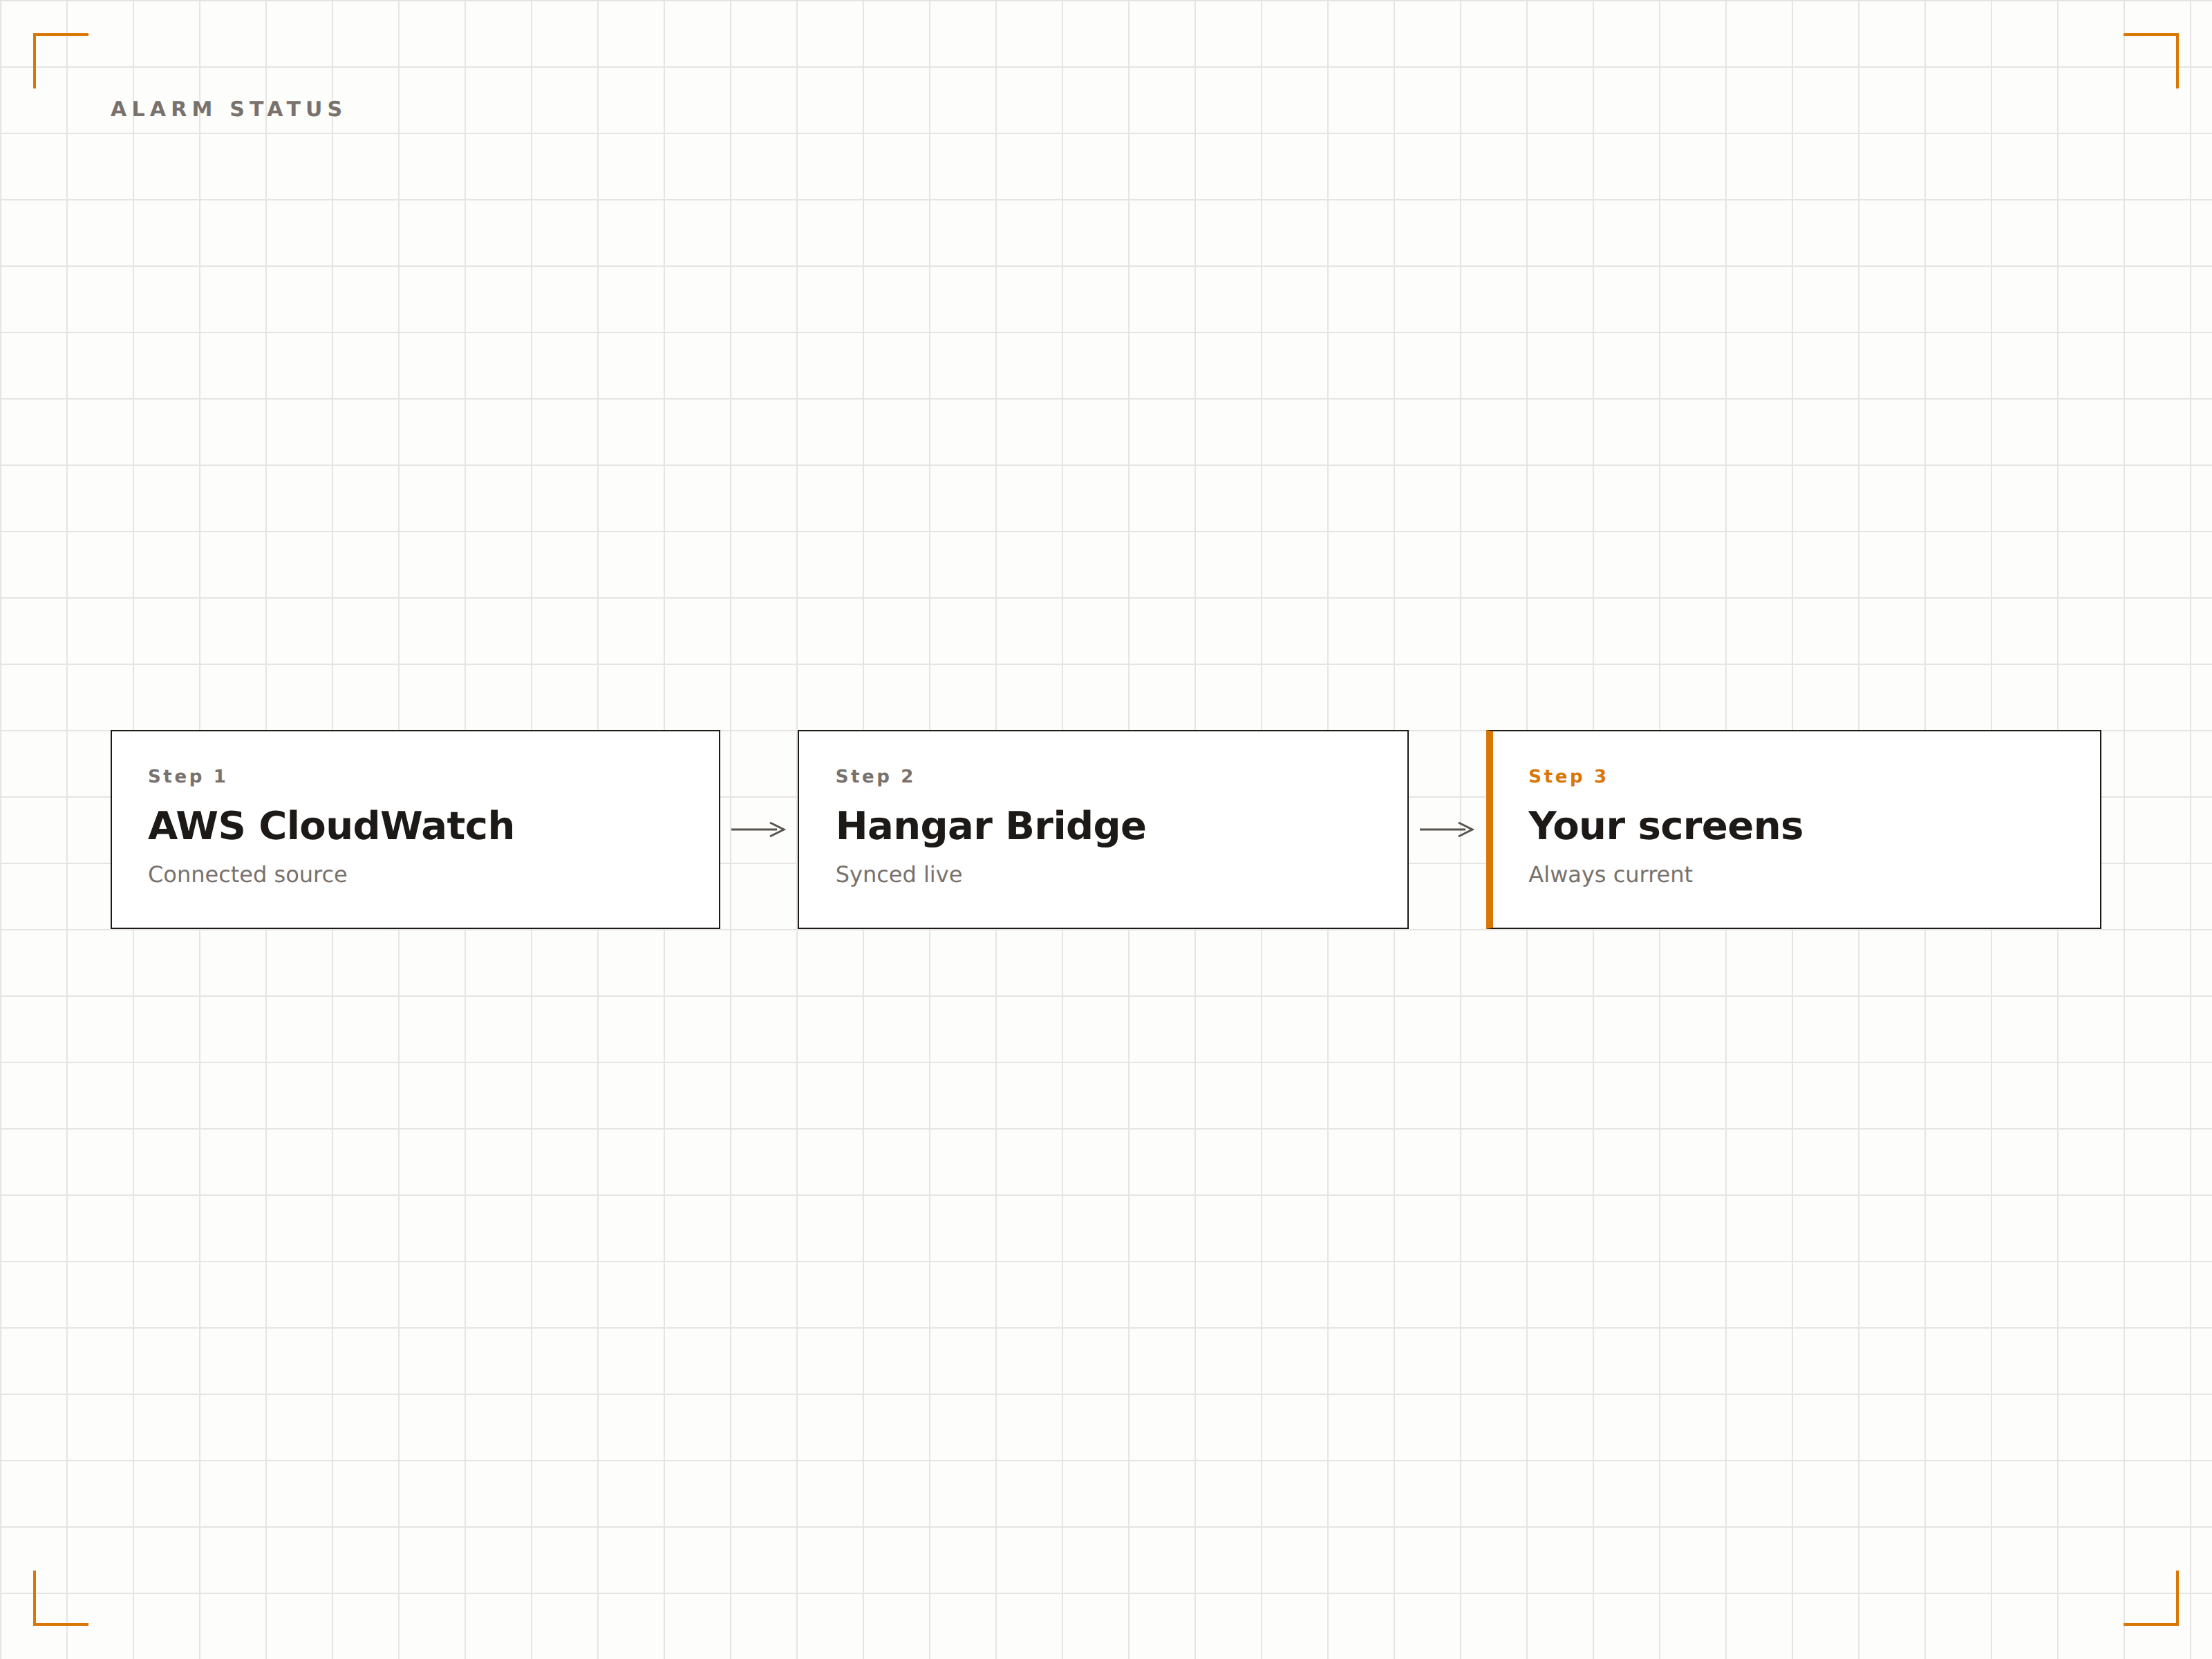
Visualizzazione Visiva dello Stato degli Allarmi
Gli allarmi di CloudWatch sono visualizzati sullo schermo con un codice colore — verde per OK, giallo per dati insufficienti, rosso per stato di allarme. Il tuo team NOC può valutare lo stato dell'infrastruttura a colpo d'occhio da qualsiasi punto della stanza, senza dover leggere i singoli valori delle metriche.
Rosso significa agire, verde significa rilassarsi. Visibile a 10 metri di distanza.
Indicatori di stato degli allarmi con codice colore
Timeline della cronologia degli allarmi sullo schermo
Viste degli allarmi raggruppate per servizio o team
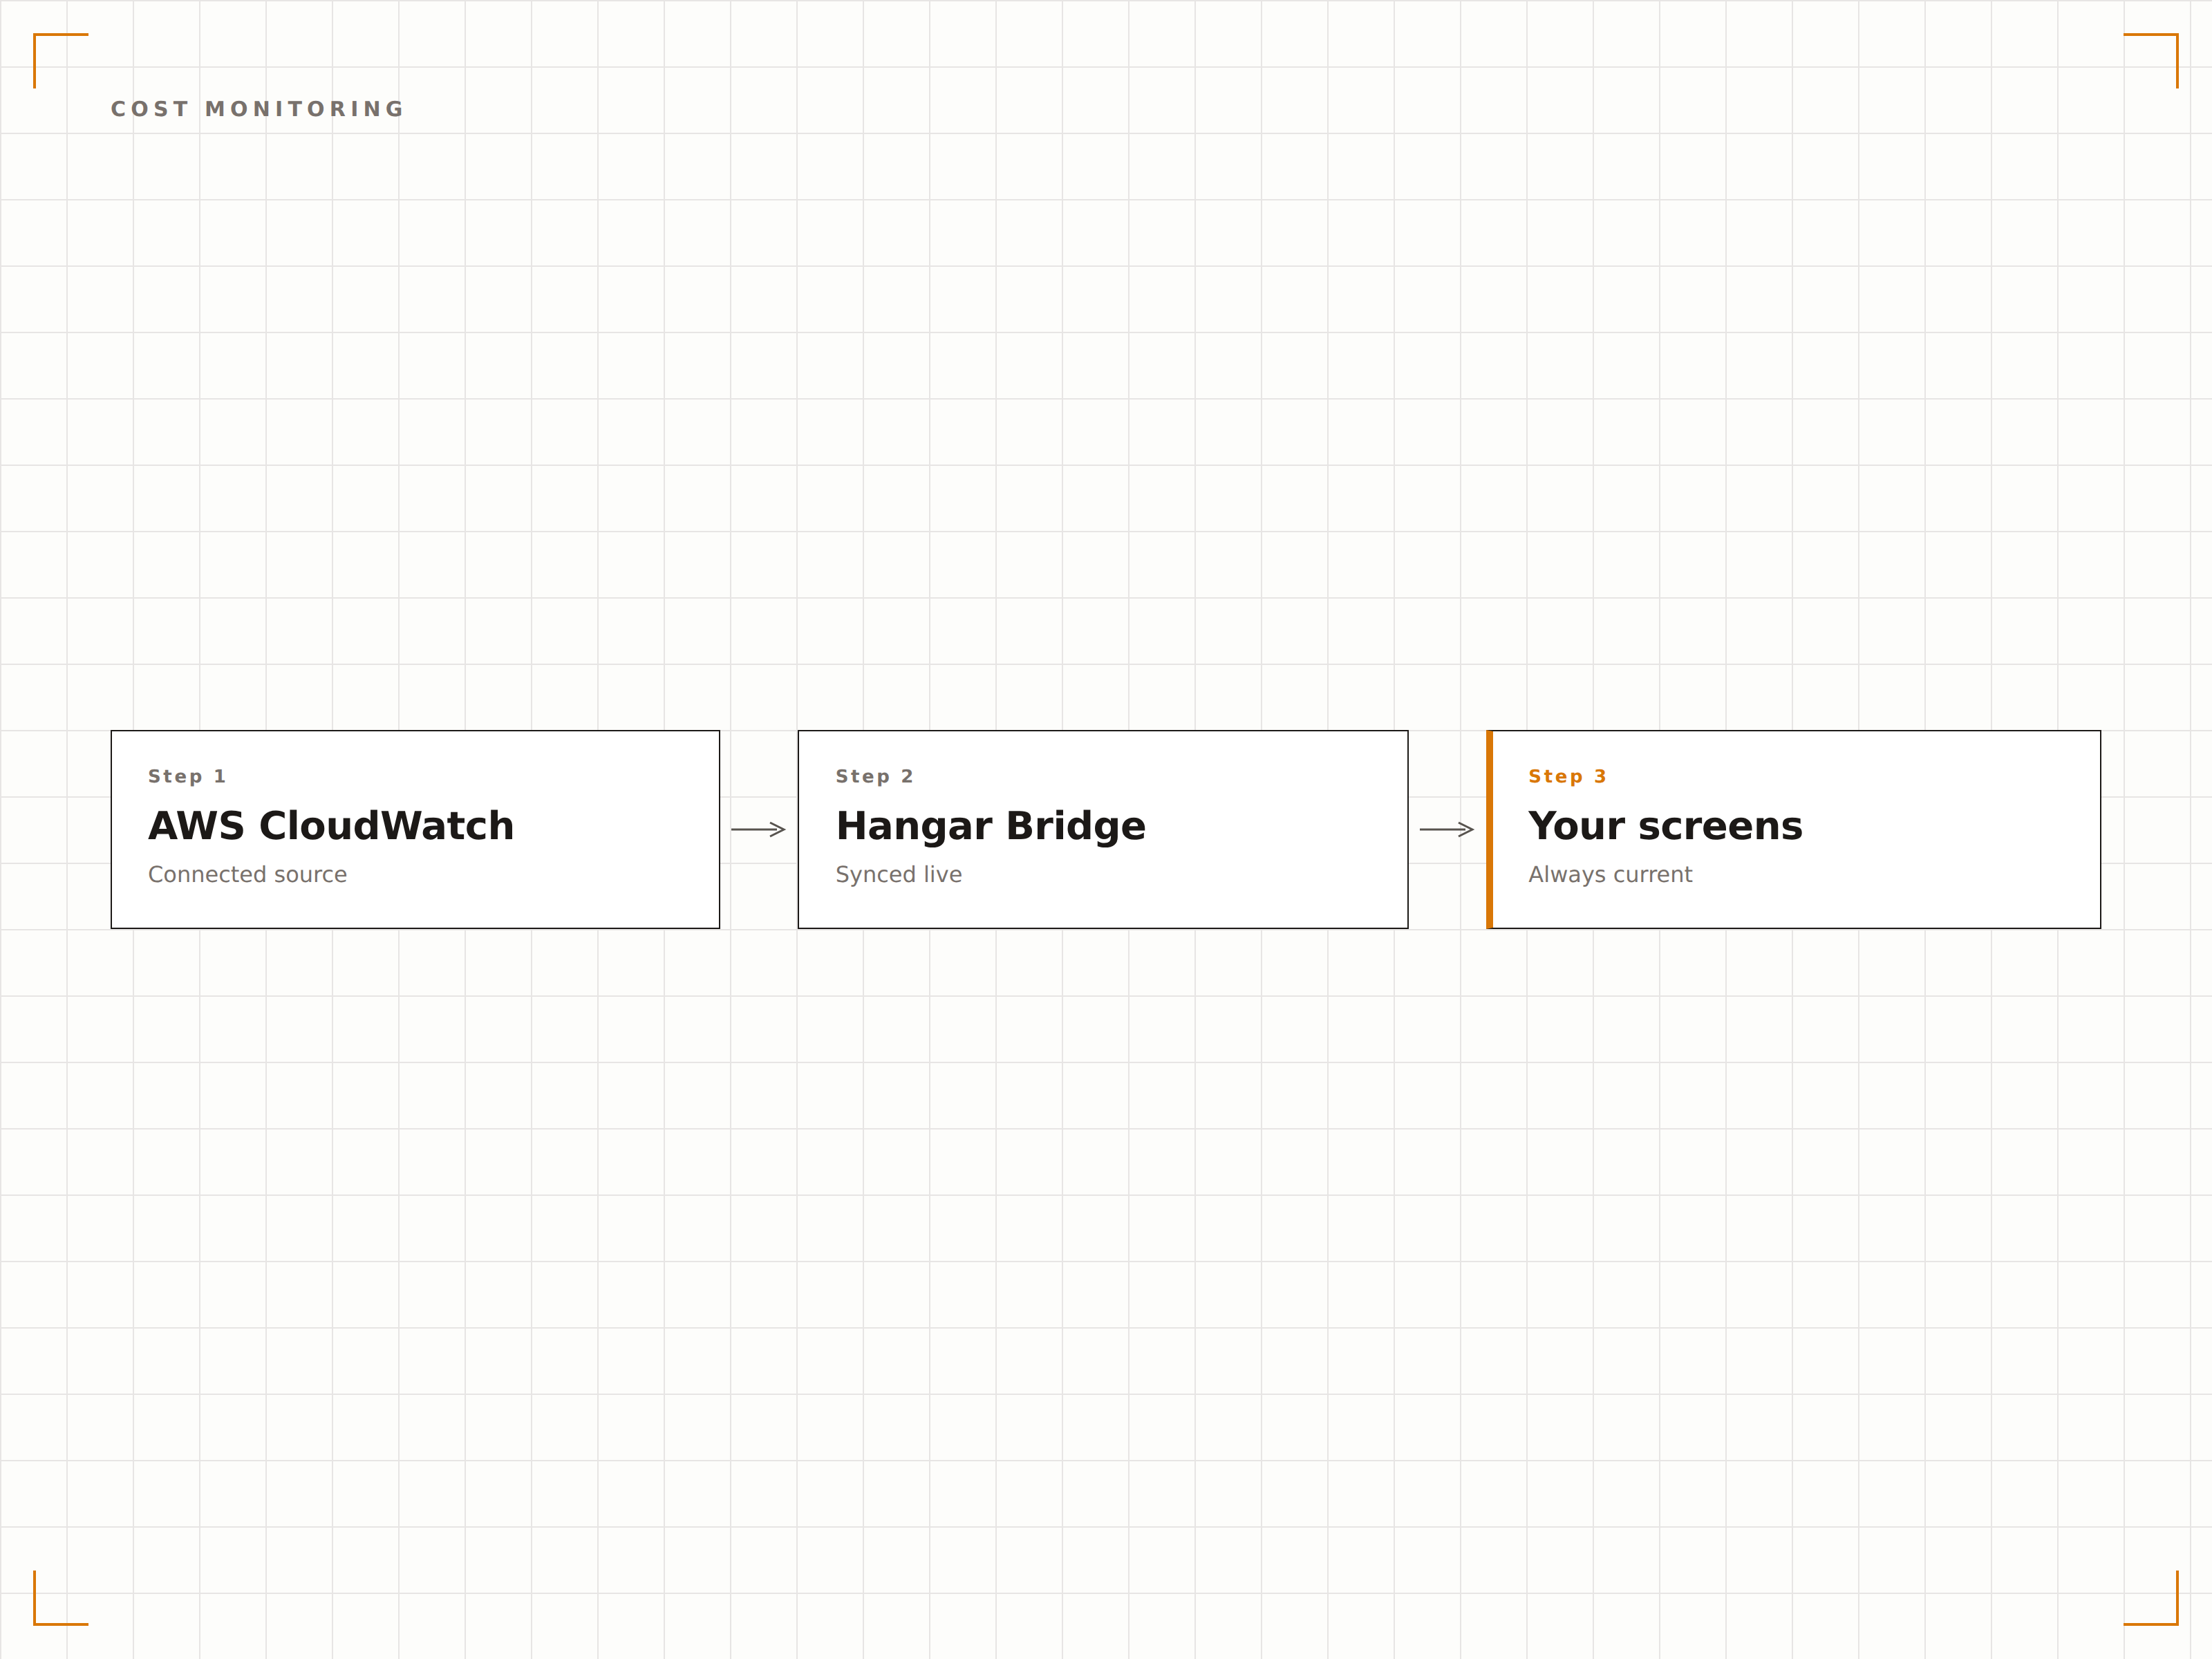
Fatturazione AWS in Evidenza
Visualizza le metriche di fatturazione e le ripartizioni dei costi di CloudWatch su schermi di segnaletica digitale. Mostra la spesa giornaliera, le previsioni mensili e le ripartizioni dei costi per servizio, così i team tecnici e finanziari mantengono la consapevolezza dei costi per tutto il mese.
I costi cloud visibili a tutti, non solo al team finanziario.
Monitoraggio della spesa giornaliera e mensile
Ripartizione dei costi per servizio AWS
Indicatori di soglia del budget
Quattro passaggi verso schermi connessi.
Dalla configurazione ai contenuti live in minuti, non giorni.
Condividi la Dashboard
In AWS CloudWatch, crea una dashboard e genera un link di condivisione, oppure configura la condivisione cross-account per l'accesso a Hangar.Media.
Aggiungi a Hangar.Media
Inserisci l'URL della dashboard CloudWatch o le impostazioni di incorporamento nel content manager di Hangar.Media.
Configura l'Aggiornamento
Imposta l'intervallo di aggiornamento e le opzioni di visualizzazione, inclusa la modalità a schermo intero e gli intervalli temporali delle metriche.
Pubblica sugli Schermi
Assegna le dashboard di CloudWatch agli schermi del NOC, ai display tecnici o ai monitor in ufficio.
Costruito per ogni settore.
Scopri come diversi settori utilizzano questa integrazione per ottenere risultati concreti.
Centro Operativo Cloud
Visualizza lo stato dell'infrastruttura AWS su una parete operativa multi-schermo che mostra metriche di calcolo, database, rete e storage per il tuo ambiente cloud.
FinancialMonitoraggio della Salute della Piattaforma
Mostra i tempi di risposta delle API, i pool di connessioni al database e le metriche di elaborazione delle transazioni per le piattaforme finanziarie in esecuzione su infrastruttura AWS.
RetailPreparazione ai Picchi di Traffico
Monitora la capacità dei gruppi di auto-scaling, lo stato del load balancer e le performance della CDN sugli schermi durante gli eventi retail ad alto traffico.
HealthcareDashboard di Conformità Cloud
Visualizza le metriche di CloudWatch insieme allo stato di conformità per i carichi di lavoro sanitari, inclusi lo stato della crittografia e i pattern di accesso.
Domande frequenti. Risposte dirette risposte.
Come posso condividere le dashboard di CloudWatch con Hangar.Media?
Puoi utilizzare la condivisione delle dashboard di CloudWatch per generare un URL pubblico o protetto. In alternativa, la funzionalità Authenticated Dashboards di Hangar.Media può gestire l'accesso alla console AWS per le dashboard private.
Posso visualizzare metriche da più account AWS?
Sì. Se utilizzi l'osservabilità cross-account di CloudWatch, le tue dashboard composite che mostrano metriche da più account AWS possono essere visualizzate sugli schermi di segnaletica digitale di Hangar.Media.
Qual è l'intervallo di aggiornamento minimo?
Hangar.Media può ricaricare le dashboard di CloudWatch con una frequenza fino a ogni 10 secondi. CloudWatch supporta una granularità delle metriche fino a 1 secondo per il monitoraggio dettagliato, anche se le metriche standard si aggiornano ogni 5 minuti.
Posso mostrare CloudWatch insieme ad altri strumenti di monitoraggio?
Sì. Puoi aggiungere le dashboard di CloudWatch a qualsiasi playlist di Hangar.Media insieme a Datadog, Grafana, New Relic o altri strumenti di monitoraggio. Puoi anche utilizzare le zone dello schermo per visualizzare più strumenti contemporaneamente.
Un prezzo. L'intera piattaforma.
Così pensiamo che la segnaletica digitale dovrebbe funzionare. Editor di contenuti, gestione degli schermi e oltre 200 integrazioni di app — tutto incluso fin dal primo giorno.