I dati sui ricavi di ChartMogul, condivisi con tutti. condivisi.
Trasmetti le analisi sugli abbonamenti di ChartMogul su schermi di segnaletica digitale per una visibilità trasparente dei ricavi in tutta la tua organizzazione.
Ricavi da Abbonamento su Ogni Schermo
ChartMogul è la piattaforma di analisi degli abbonamenti di cui si fidano migliaia di aziende SaaS per monitorare MRR, ARR, churn e customer lifetime value. Hangar.Media visualizza le dashboard di ChartMogul sugli schermi del tuo ufficio, così l'intero team ha visibilità costante sull'andamento dei ricavi, sulle performance per coorte e sui trend di crescita.
Cosa puoi fare con condivisi.
Tre funzionalità che rendono questa integrazione indispensabile per la tua rete di segnaletica digitale.
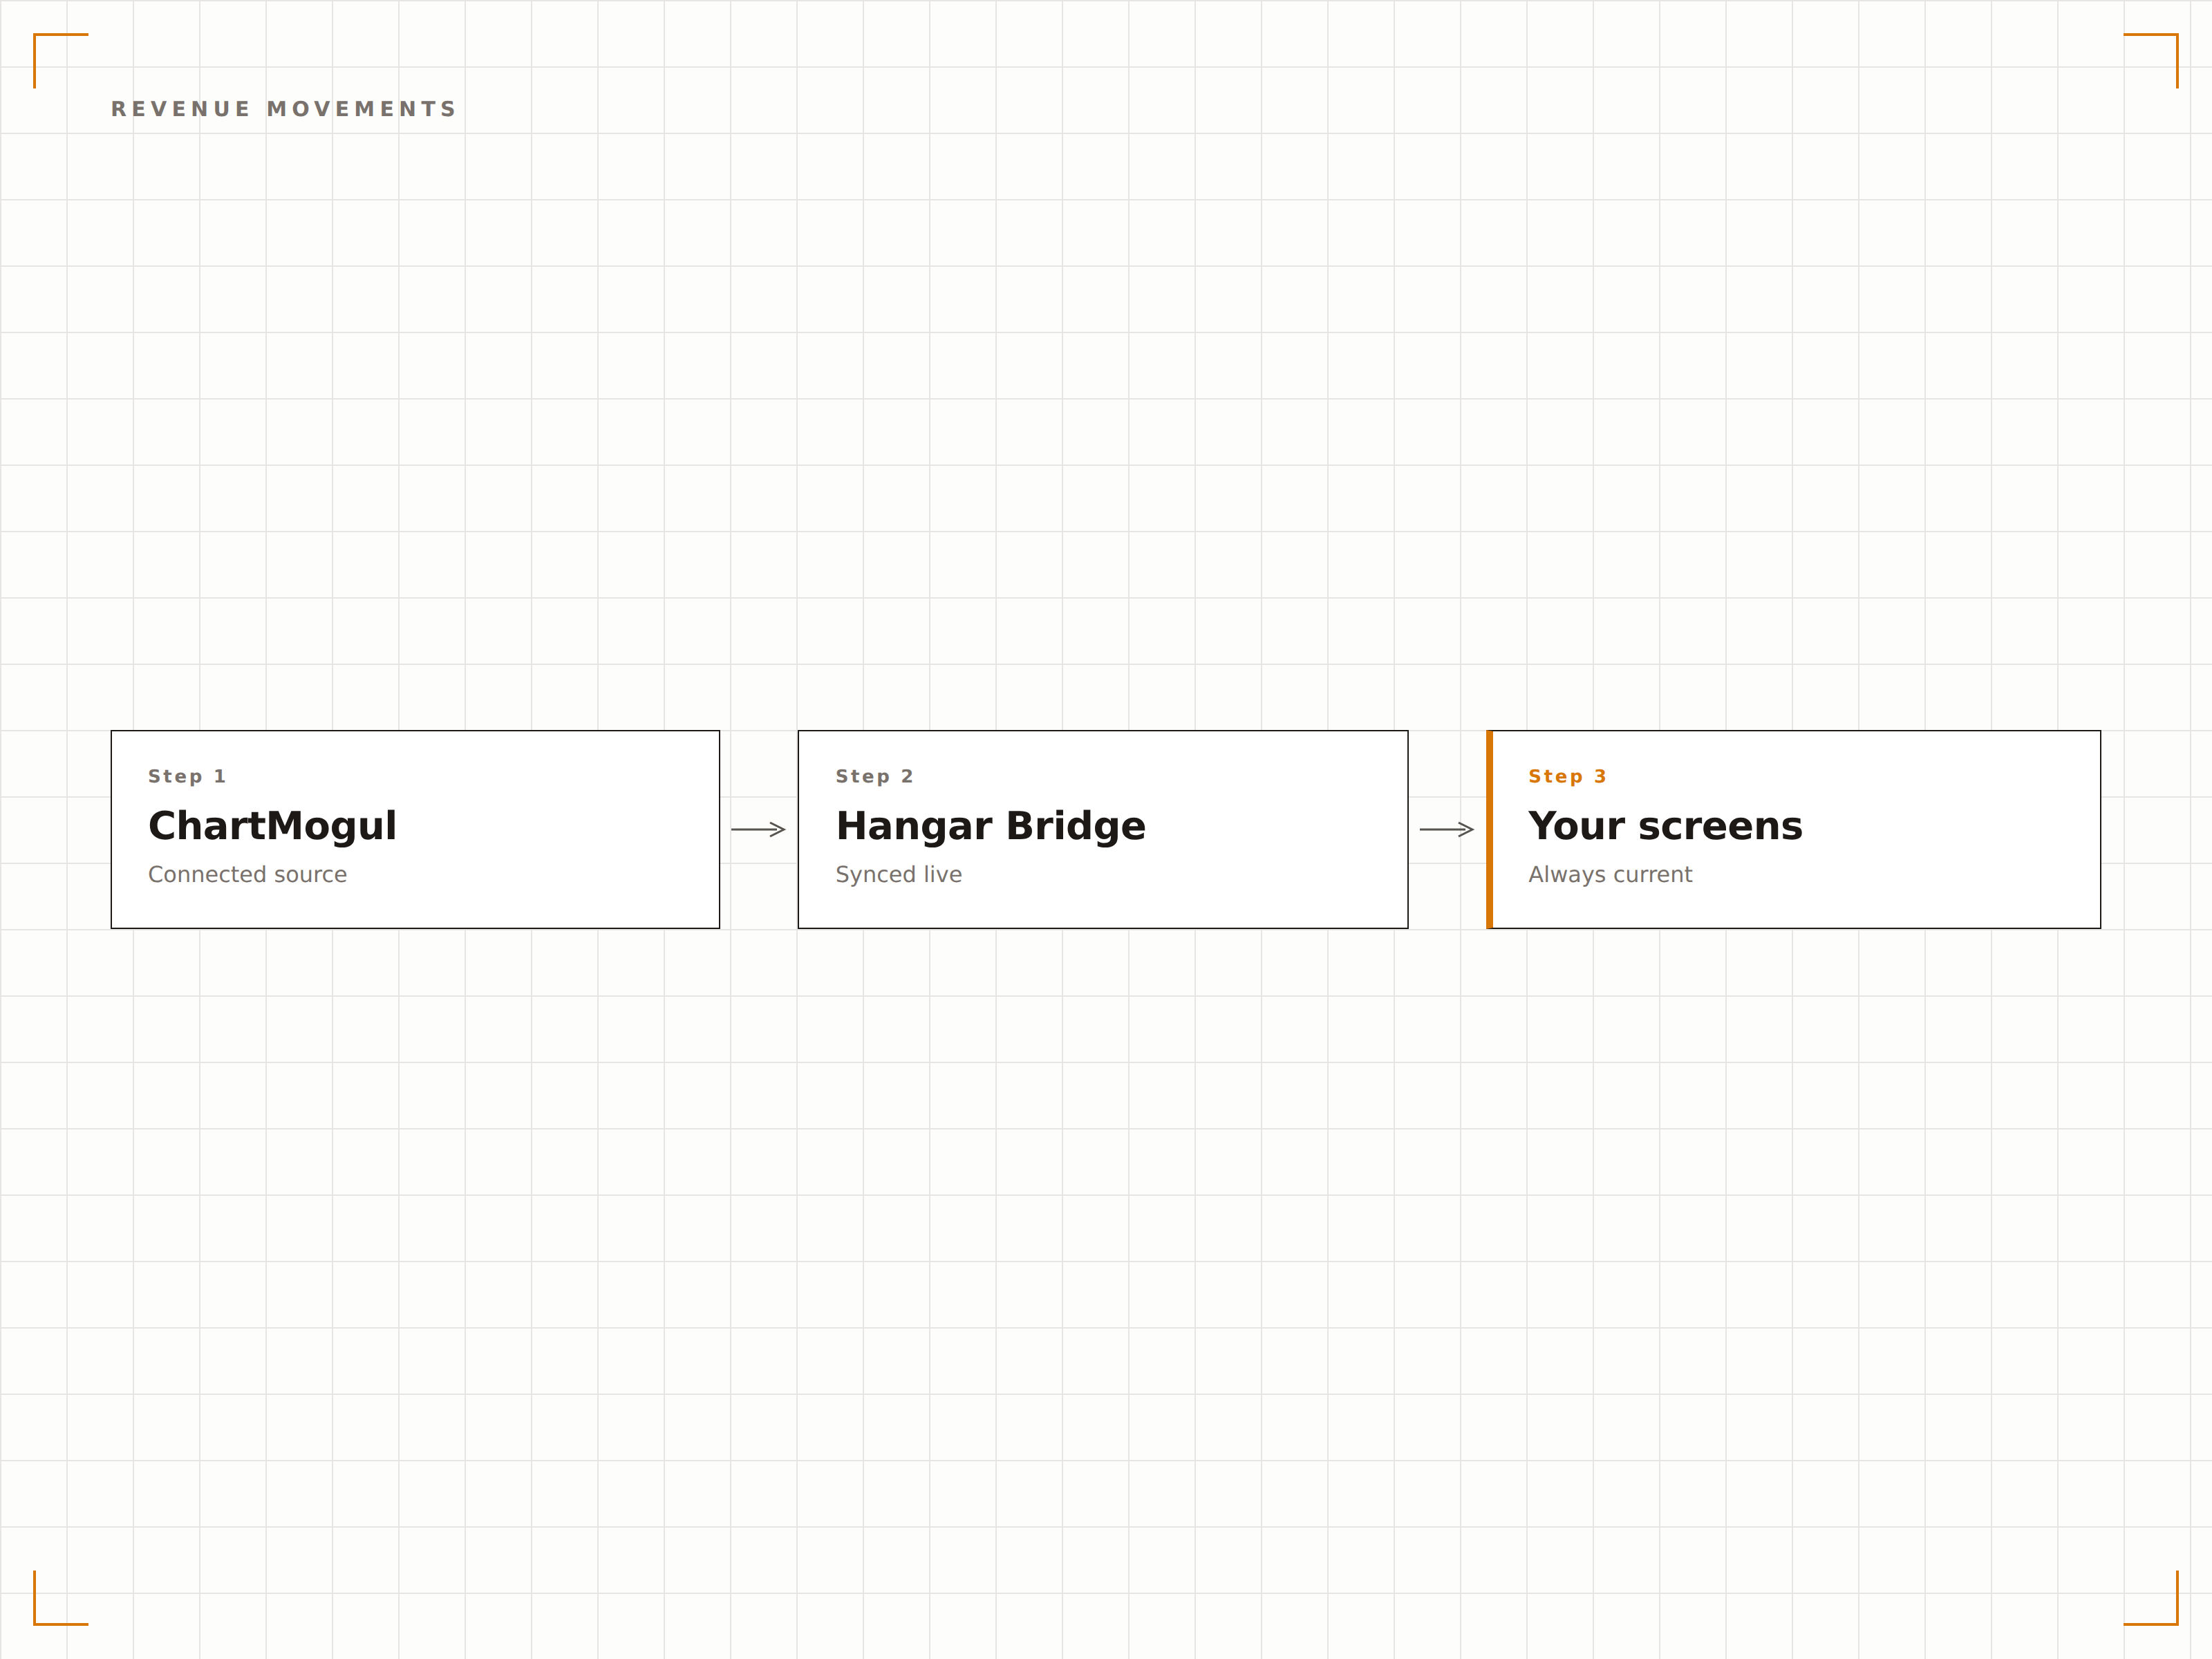
Breakdown MRR sullo schermo
ChartMogul suddivide l'MRR in componenti di nuovi contratti, espansione, contrazione, churn e riattivazione. Visualizza questo breakdown sugli schermi di segnaletica così il team può vedere esattamente cosa sta guidando la crescita o il calo dei ricavi.
Movimenti dei ricavi scomposti, visibili a tutto il team.
Breakdown di nuovi contratti, espansione, contrazione e churn
Visualizzazione del movimento MRR netto
Linee di tendenza dei ricavi mese su mese
Coorte di retention in display
L'analisi di coorte di ChartMogul mostra come diversi gruppi di clienti si mantengono nel tempo. Visualizza le tabelle di coorte sugli schermi di segnaletica per mettere in evidenza i pattern di retention e identificare i momenti in cui i clienti sono più a rischio di churn.
Pattern di coorte visibili a prodotto, marketing e leadership.
Tabelle mensili di retention per coorte
Mappa di calore visiva dei tassi di retention
Visualizzazioni dei ricavi e del numero di clienti per coorte

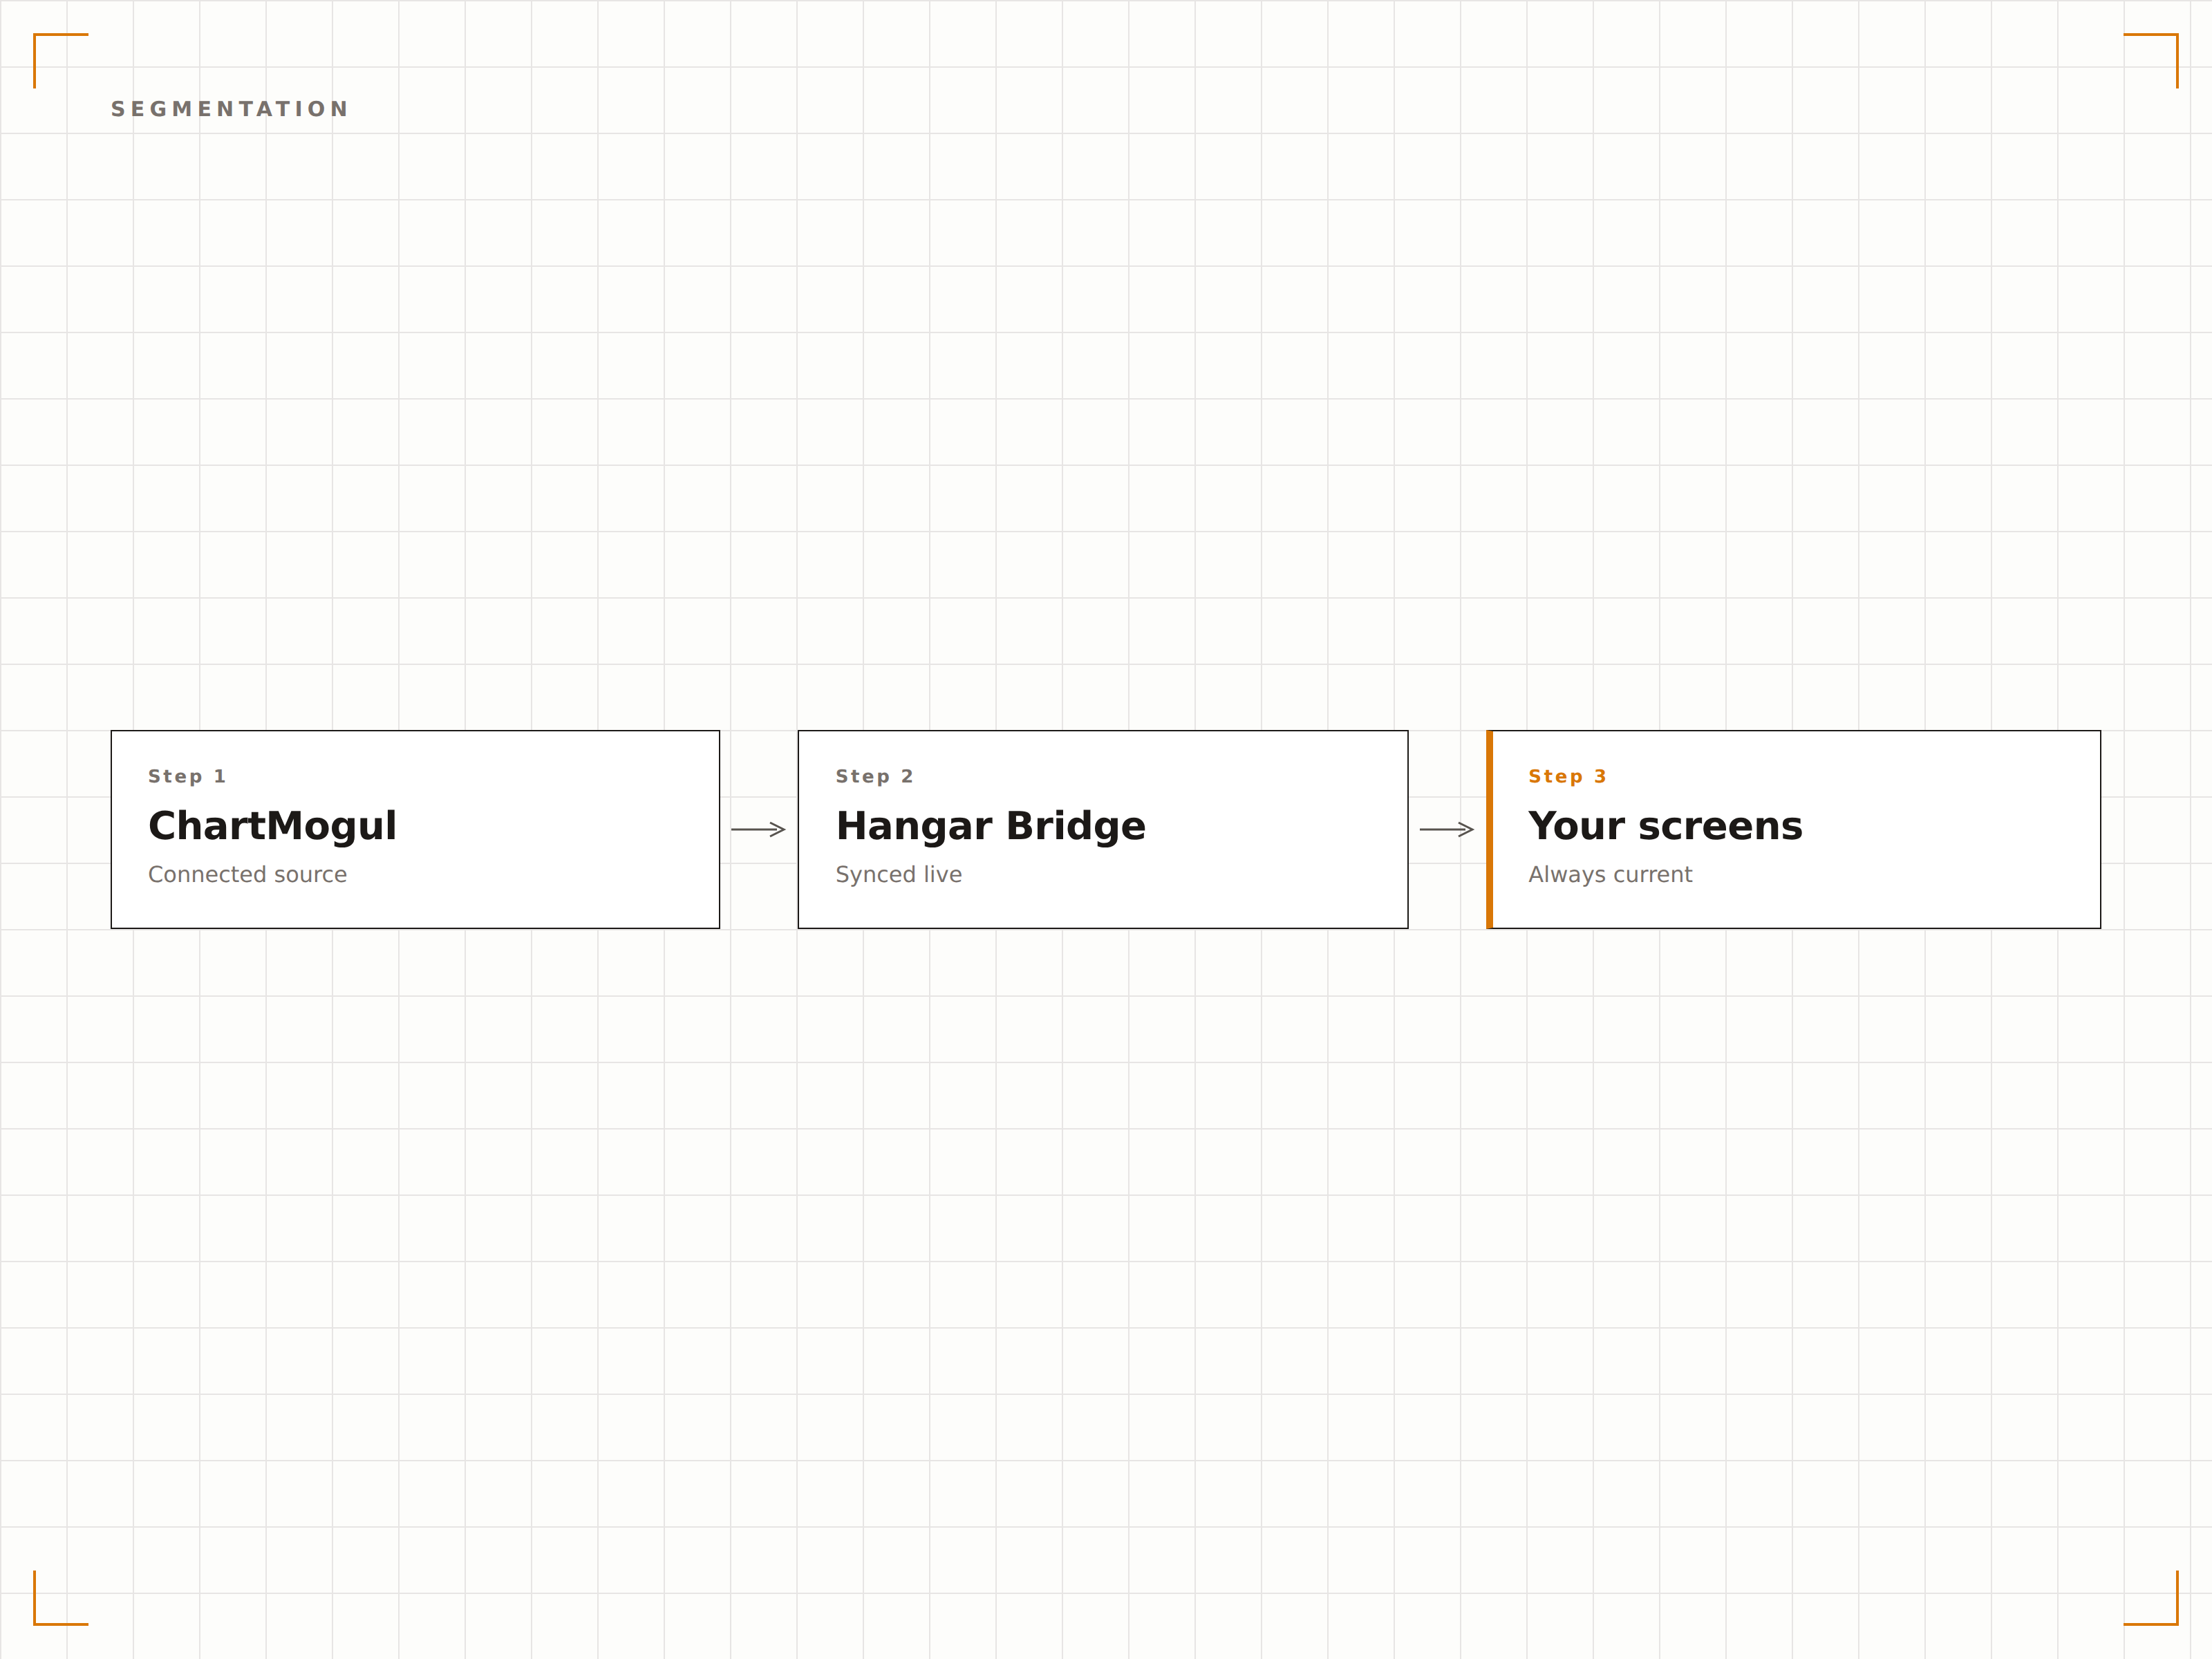
Ricavi per segmento
Filtra le analisi di ChartMogul per piano, area geografica o attributi personalizzati e visualizza i dati sui ricavi segmentati su schermi di segnaletica diversi. Mostra i ricavi enterprise su uno schermo e le metriche SMB su un altro.
Ogni segmento ha la sua storia di ricavi.
Breakdown dei ricavi a livello di piano
Segmentazione geografica dei ricavi
Filtraggio per attributi personalizzati
Quattro passaggi verso schermi connessi.
Dalla configurazione ai contenuti live in minuti, non giorni.
Configura ChartMogul
Assicurati che il tuo account ChartMogul sia connesso al provider di fatturazione e che i dati sui ricavi si sincronizzino correttamente.
Configura la condivisione
Genera un link di dashboard condivisa o configura un accesso autenticato per Hangar.Media.
Aggiungi a Hangar.Media
Inserisci l'URL della dashboard ChartMogul nel content manager di Hangar.Media e imposta le preferenze di visualizzazione.
Vai live
Assegna agli schermi del tuo ufficio e le analisi degli abbonamenti appariranno sui tuoi display di segnaletica.
Costruito per ogni settore.
Scopri come diversi settori utilizzano questa integrazione per ottenere risultati concreti.
Trasparenza dei ricavi
Visualizza MRR, ARR e tasso di crescita aziendale su uno schermo nell'area principale dell'ufficio per costruire una cultura di trasparenza sui ricavi.
FinanceMetriche per il Consiglio di Amministrazione
Mostra le dashboard dei ricavi di ChartMogul sullo schermo della sala riunioni durante gli incontri con investitori e board per un reporting finanziario in tempo reale.
CorporateMetriche di Customer Success
Visualizza tassi di churn, ricavi da espansione e coorti di retention sugli schermi nell'area del team customer success per orientare le strategie di fidelizzazione.
EducationMonitoraggio dei ricavi EdTech
Mostra le metriche di abbonamento per piattaforme SaaS nel settore education sugli schermi nell'area del team business, monitorando la salute degli abbonamenti di scuole e distretti.
Domande frequenti. Risposte dirette risposte.
Quali provider di fatturazione supporta ChartMogul?
ChartMogul si connette a Stripe, Chargebee, Recurly, Braintree, Paddle e molti altri provider di fatturazione. Supporta inoltre l'importazione di dati personalizzati tramite API. Tutti i dati connessi sono disponibili per la visualizzazione sugli schermi di Hangar.Media.
Posso visualizzare solo grafici specifici di ChartMogul?
ChartMogul consente di condividere visualizzazioni specifiche della dashboard. Puoi creare dashboard mirate che mostrano solo i trend MRR, solo le tabelle di coorte o solo le metriche di churn e visualizzare ciascuna su schermi di segnaletica diversi.
Quanto sono aggiornati i dati sullo schermo?
ChartMogul si sincronizza continuamente con i provider di fatturazione. Hangar.Media ricarica la dashboard all'intervallo da te scelto. I dati sui ricavi sullo schermo della tua segnaletica sono in genere aggiornati entro poche ore dagli eventi di fatturazione effettivi.
I dati di ChartMogul sono al sicuro sugli schermi di segnaletica?
Le dashboard condivise di ChartMogul possono essere configurate con protezione tramite password o accesso limitato. Hangar.Media esegue il rendering della dashboard localmente sul dispositivo player. Consigliamo di visualizzare metriche aggregate anziché dati di singoli clienti sugli schermi rivolti al pubblico.
Un prezzo. L'intera piattaforma.
Così pensiamo che la segnaletica digitale dovrebbe funzionare. Editor di contenuti, gestione degli schermi e oltre 200 integrazioni di app — tutto incluso fin dal primo giorno.