Le dashboard Grafana oltre il NOC.
Porta i tuoi dashboard di monitoraggio Grafana sulla segnaletica digitale così la salute dell'infrastruttura e le metriche applicative sono visibili a tutti coloro che ne hanno bisogno.
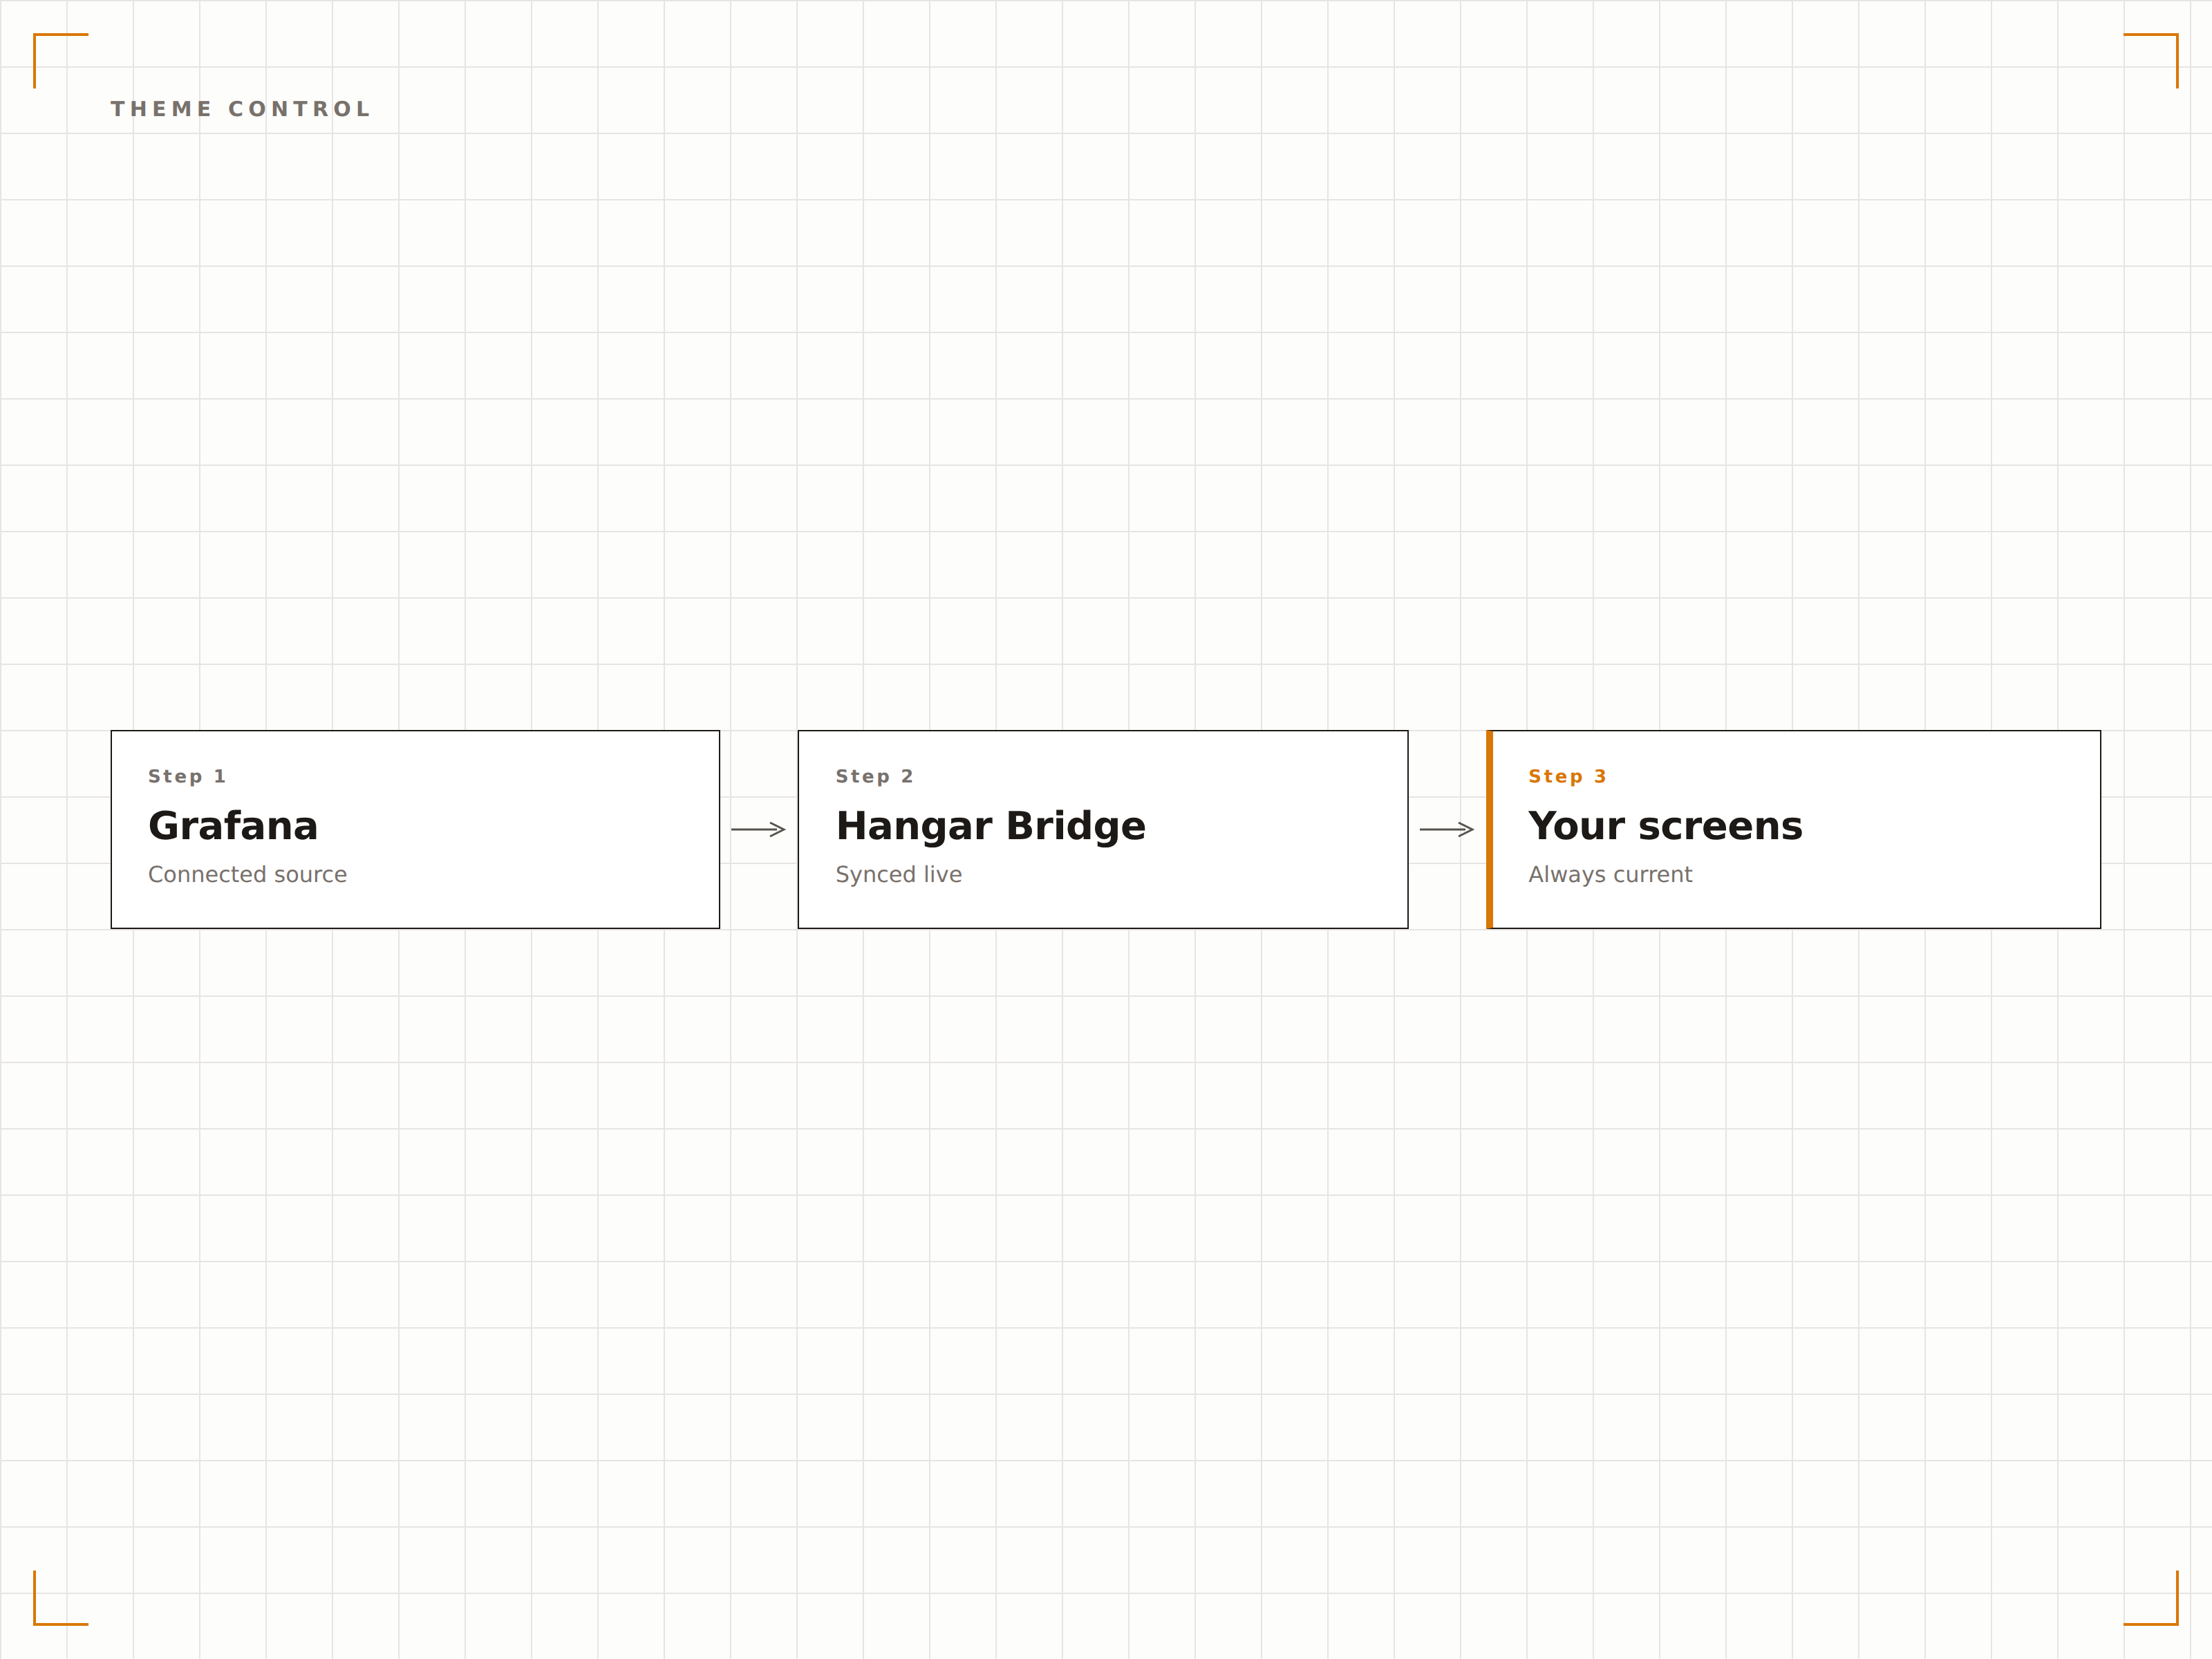
Observability su Ogni Schermo
Grafana è lo standard per i dashboard di monitoraggio di infrastrutture e applicazioni. Con Hangar.Media, puoi trasmettere quei dashboard agli schermi del tuo NOC, del piano engineering o della reception. I dashboard si aggiornano automaticamente a intervalli sub-minuto e vengono visualizzati a schermo intero, preservando il tema scuro o chiaro.
Cosa puoi fare con oltre il NOC.
Tre funzionalità che rendono questa integrazione indispensabile per la tua rete di segnaletica digitale.
Aggiornamento Dati Sotto il Minuto
Le dashboard Grafana su Hangar.Media si aggiornano fino a ogni 5 secondi, in linea con le impostazioni di refresh dei tuoi pannelli Grafana. Grafici time-series, gauge e pannelli stat si aggiornano in tempo quasi reale, così i tuoi schermi NOC riflettono sempre lo stato attuale del sistema.
Aggiornamento ogni cinque secondi: il tuo display a parete è aggiornato quanto il tuo laptop.
Intervalli di aggiornamento da 5 secondi a 60 minuti
Compatibile con le impostazioni di auto-refresh dei pannelli Grafana
I grafici time-series scorrono in tempo reale

Ciclo Automatico delle Dashboard
Utilizza le playlist native di Grafana o le regole di rotazione di Hangar.Media per scorrere tra più dashboard. Mostra le metriche di rete per 30 secondi, poi le performance applicative per 30 secondi, poi lo stato del database — tutto in automatico.
Un solo schermo, ogni metrica, zero cambi manuali.
Integrazione nativa con le playlist di Grafana
Regole di rotazione personalizzate in Hangar.Media
Impostazioni di tempo di visualizzazione per singola dashboard

Supporto Modalità Chiara e Scura
Le dashboard Grafana vengono visualizzate con il loro tema nativo sugli schermi della segnaletica. Usa la dark mode per gli ambienti NOC dove gli schermi sono attivi 24/7, o la light mode per le lobby degli uffici e gli spazi condivisi dove la leggibilità è fondamentale.
Dark mode nel NOC, light mode nella lobby.
Mantieni le impostazioni del tema della dashboard
Sovrascrivi il tema per singolo schermo se necessario
La modalità kiosk rimuove tutta la navigazione di Grafana
Quattro passaggi verso schermi connessi.
Dalla configurazione ai contenuti live in minuti, non giorni.
Abilita la Condivisione
Configura l'accesso anonimo o genera un'API key nella tua istanza Grafana per consentire l'autenticazione a Hangar.Media.
Aggiungi gli URL delle Dashboard
Copia gli URL delle tue dashboard Grafana e incollali nel content manager di Hangar.Media.
Imposta Aggiornamento e Rotazione
Configura gli intervalli di aggiornamento, la modalità playlist e le impostazioni di visualizzazione kiosk per i tuoi schermi.
Pubblica sugli Schermi
Assegna le dashboard Grafana al tuo NOC wall, al piano engineering o agli schermi in ufficio e pubblica.
Costruito per ogni settore.
Scopri come diversi settori utilizzano questa integrazione per ottenere risultati concreti.
Display NOC a Parete
Trasmetti le dashboard di stato dell'infrastruttura su un NOC wall multi-schermo che mostra in tempo reale lo stato dei server, il throughput di rete e il conteggio degli alert.
FinancialSchermi per l'Affidabilità della Piattaforma
Mostra metriche di uptime, tassi di elaborazione delle transazioni e percentuali di errore su schermi nell'area engineering di aziende fintech.
HealthcareMonitoraggio dello Stato dei Sistemi
Visualizza uptime dei sistemi critici, latenza di rete e performance applicative per l'infrastruttura IT ospedaliera su schermi nella sala operativa IT.
EducationDashboard di Rete del Campus
Mostra l'utilizzo della rete universitaria, il carico degli access point Wi-Fi e la disponibilità dei servizi su schermi nell'area help desk IT.
Domande frequenti. Risposte dirette risposte.
Hangar.Media funziona con Grafana Cloud?
Sì. Hangar.Media supporta Grafana Cloud, Grafana OSS self-hosted e Grafana Enterprise. Puoi utilizzare link snapshot, dashboard pubbliche o autenticazione tramite API key, a seconda della tua configurazione Grafana.
Posso visualizzare gli alert di Grafana sullo schermo della segnaletica?
I pannelli di alert e i widget con elenco degli alert di Grafana vengono visualizzati come parte della dashboard. Se la tua dashboard include indicatori di stato degli alert o pannelli con la cronologia degli alert, appariranno sullo schermo della segnaletica esattamente come nel browser.
Cosa succede se il server Grafana non è raggiungibile?
Hangar.Media mostrerà l'ultimo frame della dashboard renderizzato con successo e ritenterà la connessione a ogni intervallo di aggiornamento. Puoi anche impostare un contenuto di fallback da visualizzare se il server Grafana risulta irraggiungibile per un periodo prolungato.
Posso mostrare le dashboard Grafana insieme ad altri contenuti?
Sì. Puoi aggiungere le dashboard Grafana a qualsiasi playlist di contenuti in Hangar.Media, combinandole con annunci, video, feed social o altri contenuti di integrazione in un'unica rotazione.
Un prezzo. L'intera piattaforma.
Così pensiamo che la segnaletica digitale dovrebbe funzionare. Editor di contenuti, gestione degli schermi e oltre 200 integrazioni di app — tutto incluso fin dal primo giorno.