Osservabilità New Relic ovunque.
Mostra dashboard di New Relic APM, infrastruttura e monitoraggio browser su schermi di segnaletica digitale per una visibilità sulle performance condivisa con tutto il team.
Osservabilità Full-Stack in Primo Piano
New Relic offre osservabilità full-stack dalle performance applicative alla salute dell'infrastruttura. Hangar.Media ti permette di visualizzare le dashboard di New Relic su schermi condivisi, garantendo al tuo team di ingegneria una visibilità costante sulle performance del sistema. Mostra punteggi Apdex, tassi di errore, throughput e metriche infrastrutturali su pareti NOC, aree engineering e sale riunioni.
Cosa puoi fare con ovunque.
Tre funzionalità che rendono questa integrazione indispensabile per la tua rete di segnaletica digitale.
Prestazioni delle Applicazioni sullo Schermo
Mostra le dashboard APM di New Relic con tempi di risposta, throughput, tassi di errore e punteggi Apdex sugli schermi della segnaletica digitale. I team di engineering ottengono una consapevolezza ambientale della salute delle applicazioni senza dover controllare i propri laptop.
La salute delle applicazioni, visibile da ogni scrivania.
Grafici di tempi di risposta e throughput
Visualizzazione del tasso di errore e del punteggio Apdex
Viste di analisi delle transazioni
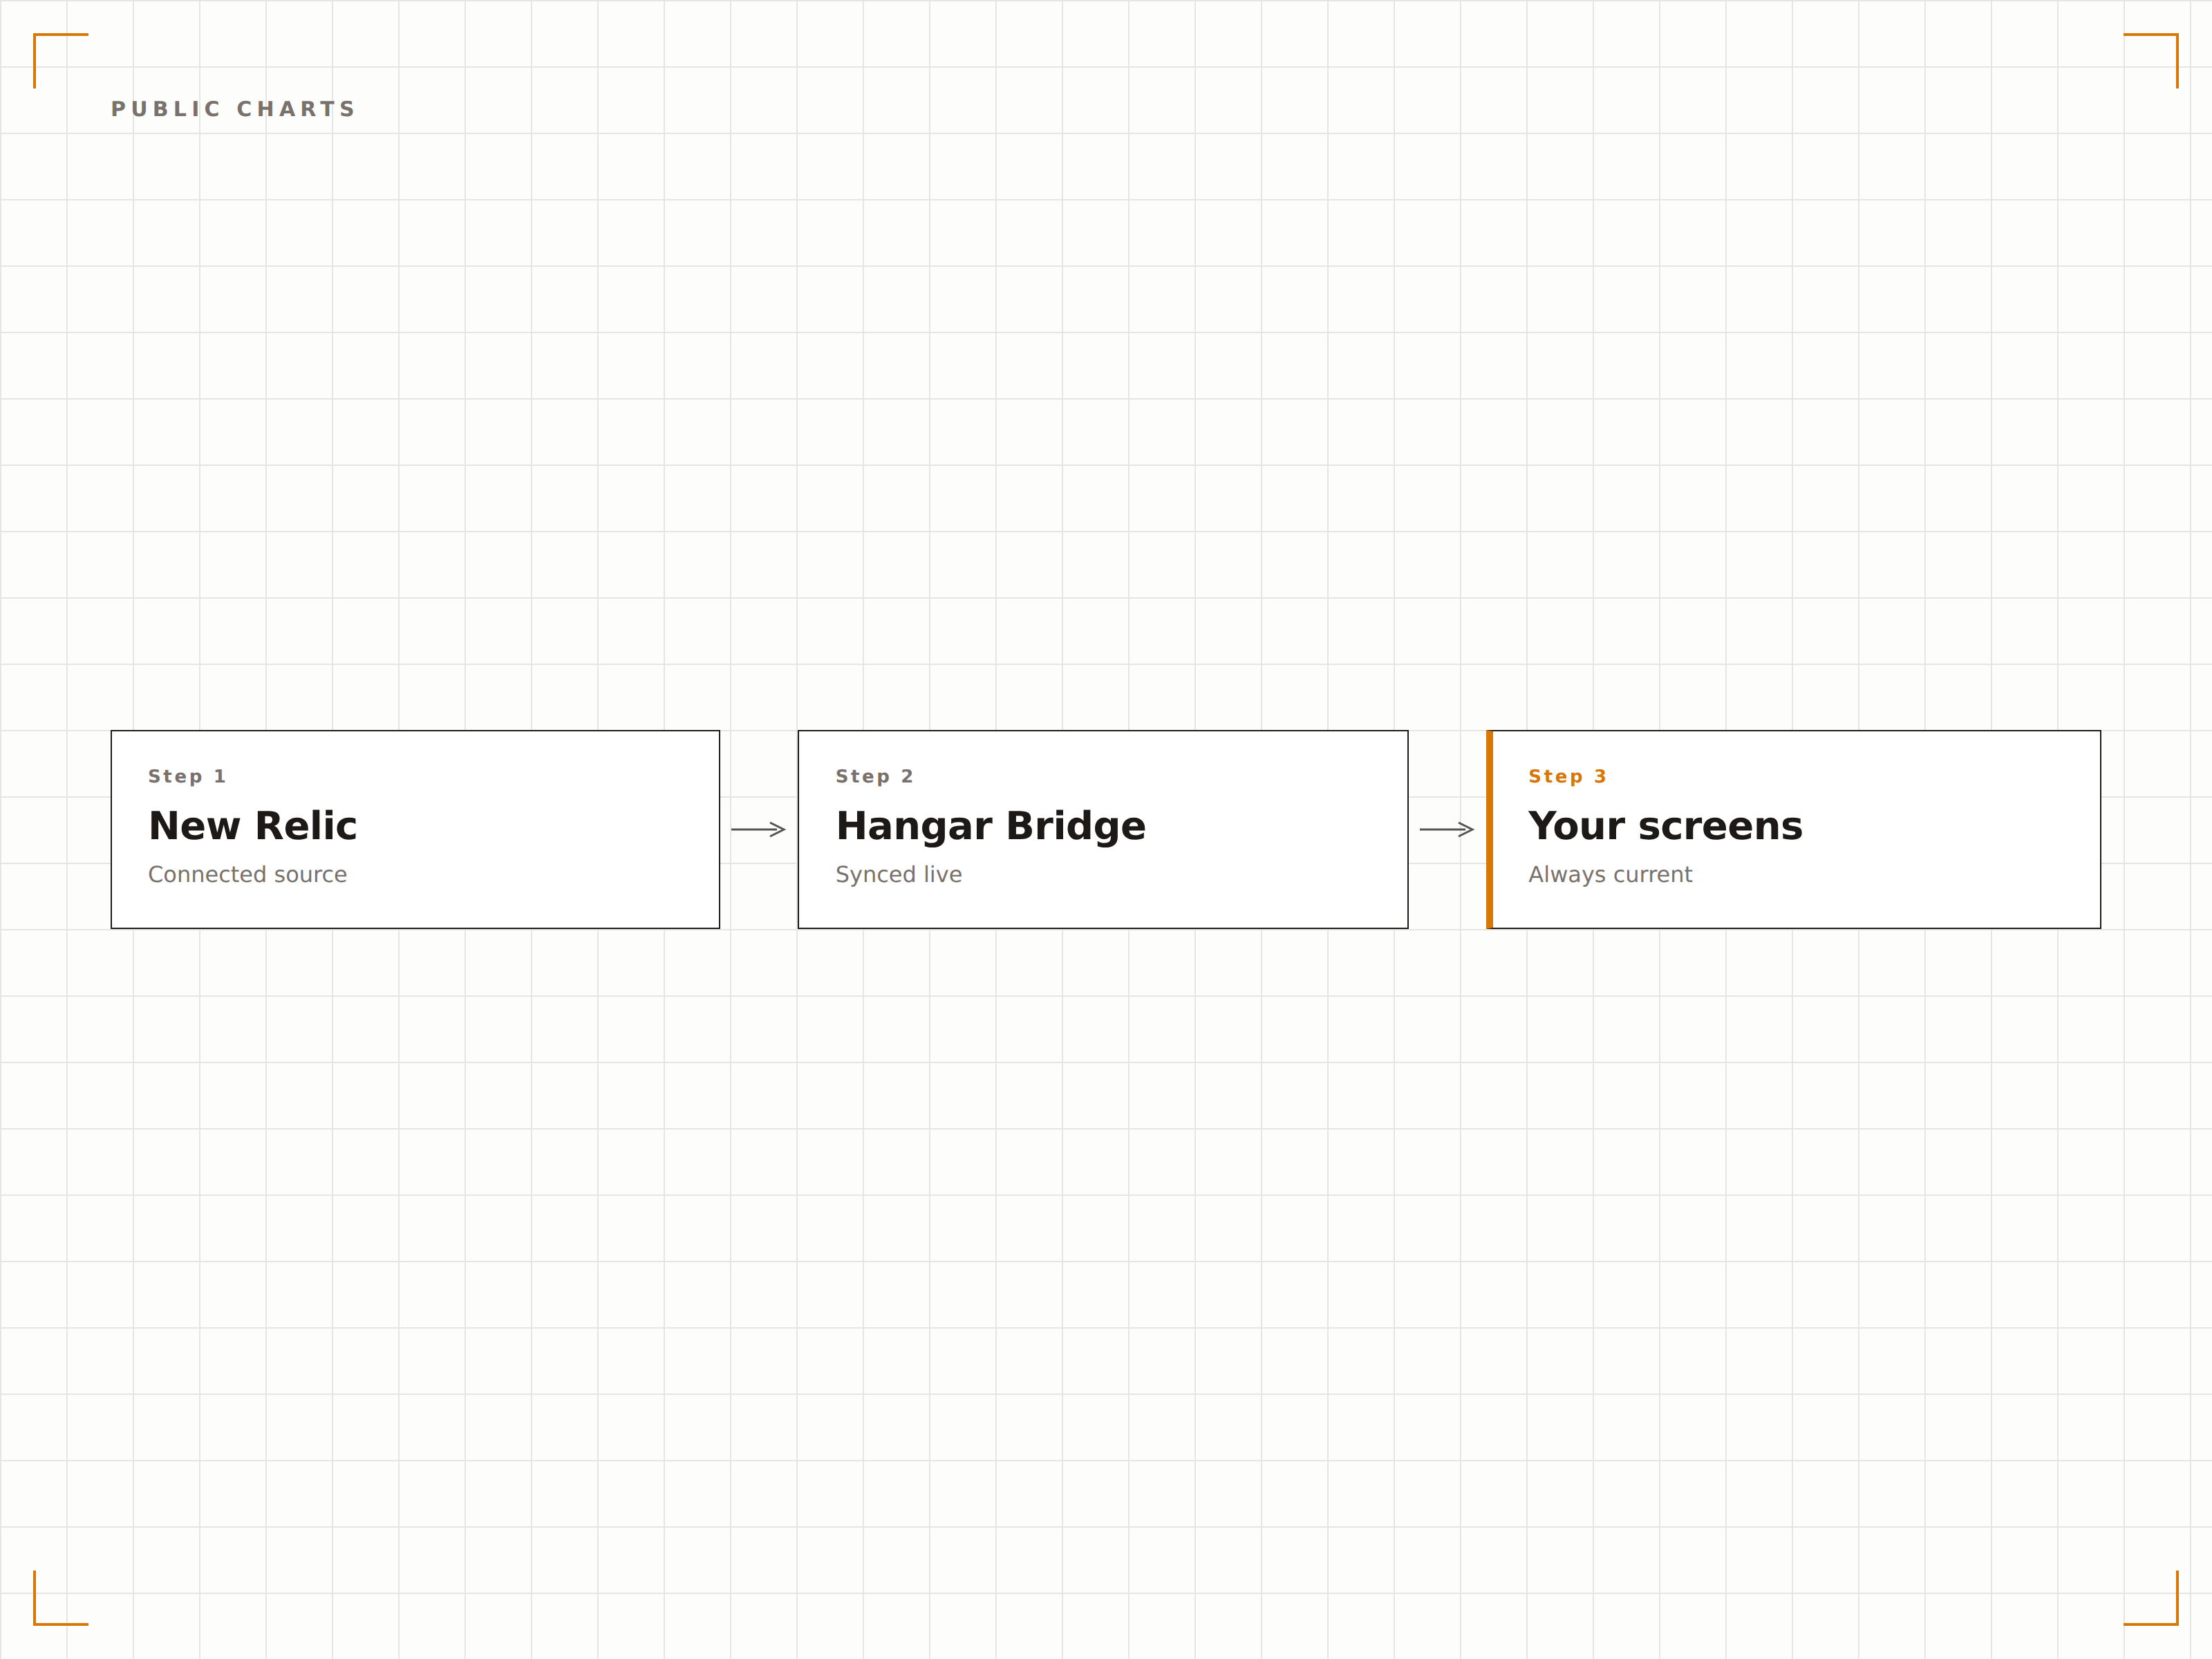
Incorporamento Semplice dei Grafici
New Relic ti consente di generare URL pubblici per singoli grafici e dashboard. Incolla questi URL in Hangar.Media per una visualizzazione immediata sui tuoi schermi di segnaletica digitale, senza alcuna configurazione API complessa.
Da New Relic al tuo schermo in meno di un minuto.
Supporto per link a grafici pubblici
Incorporamento di singoli grafici o dashboard complete
Nessuna configurazione di chiavi API richiesta
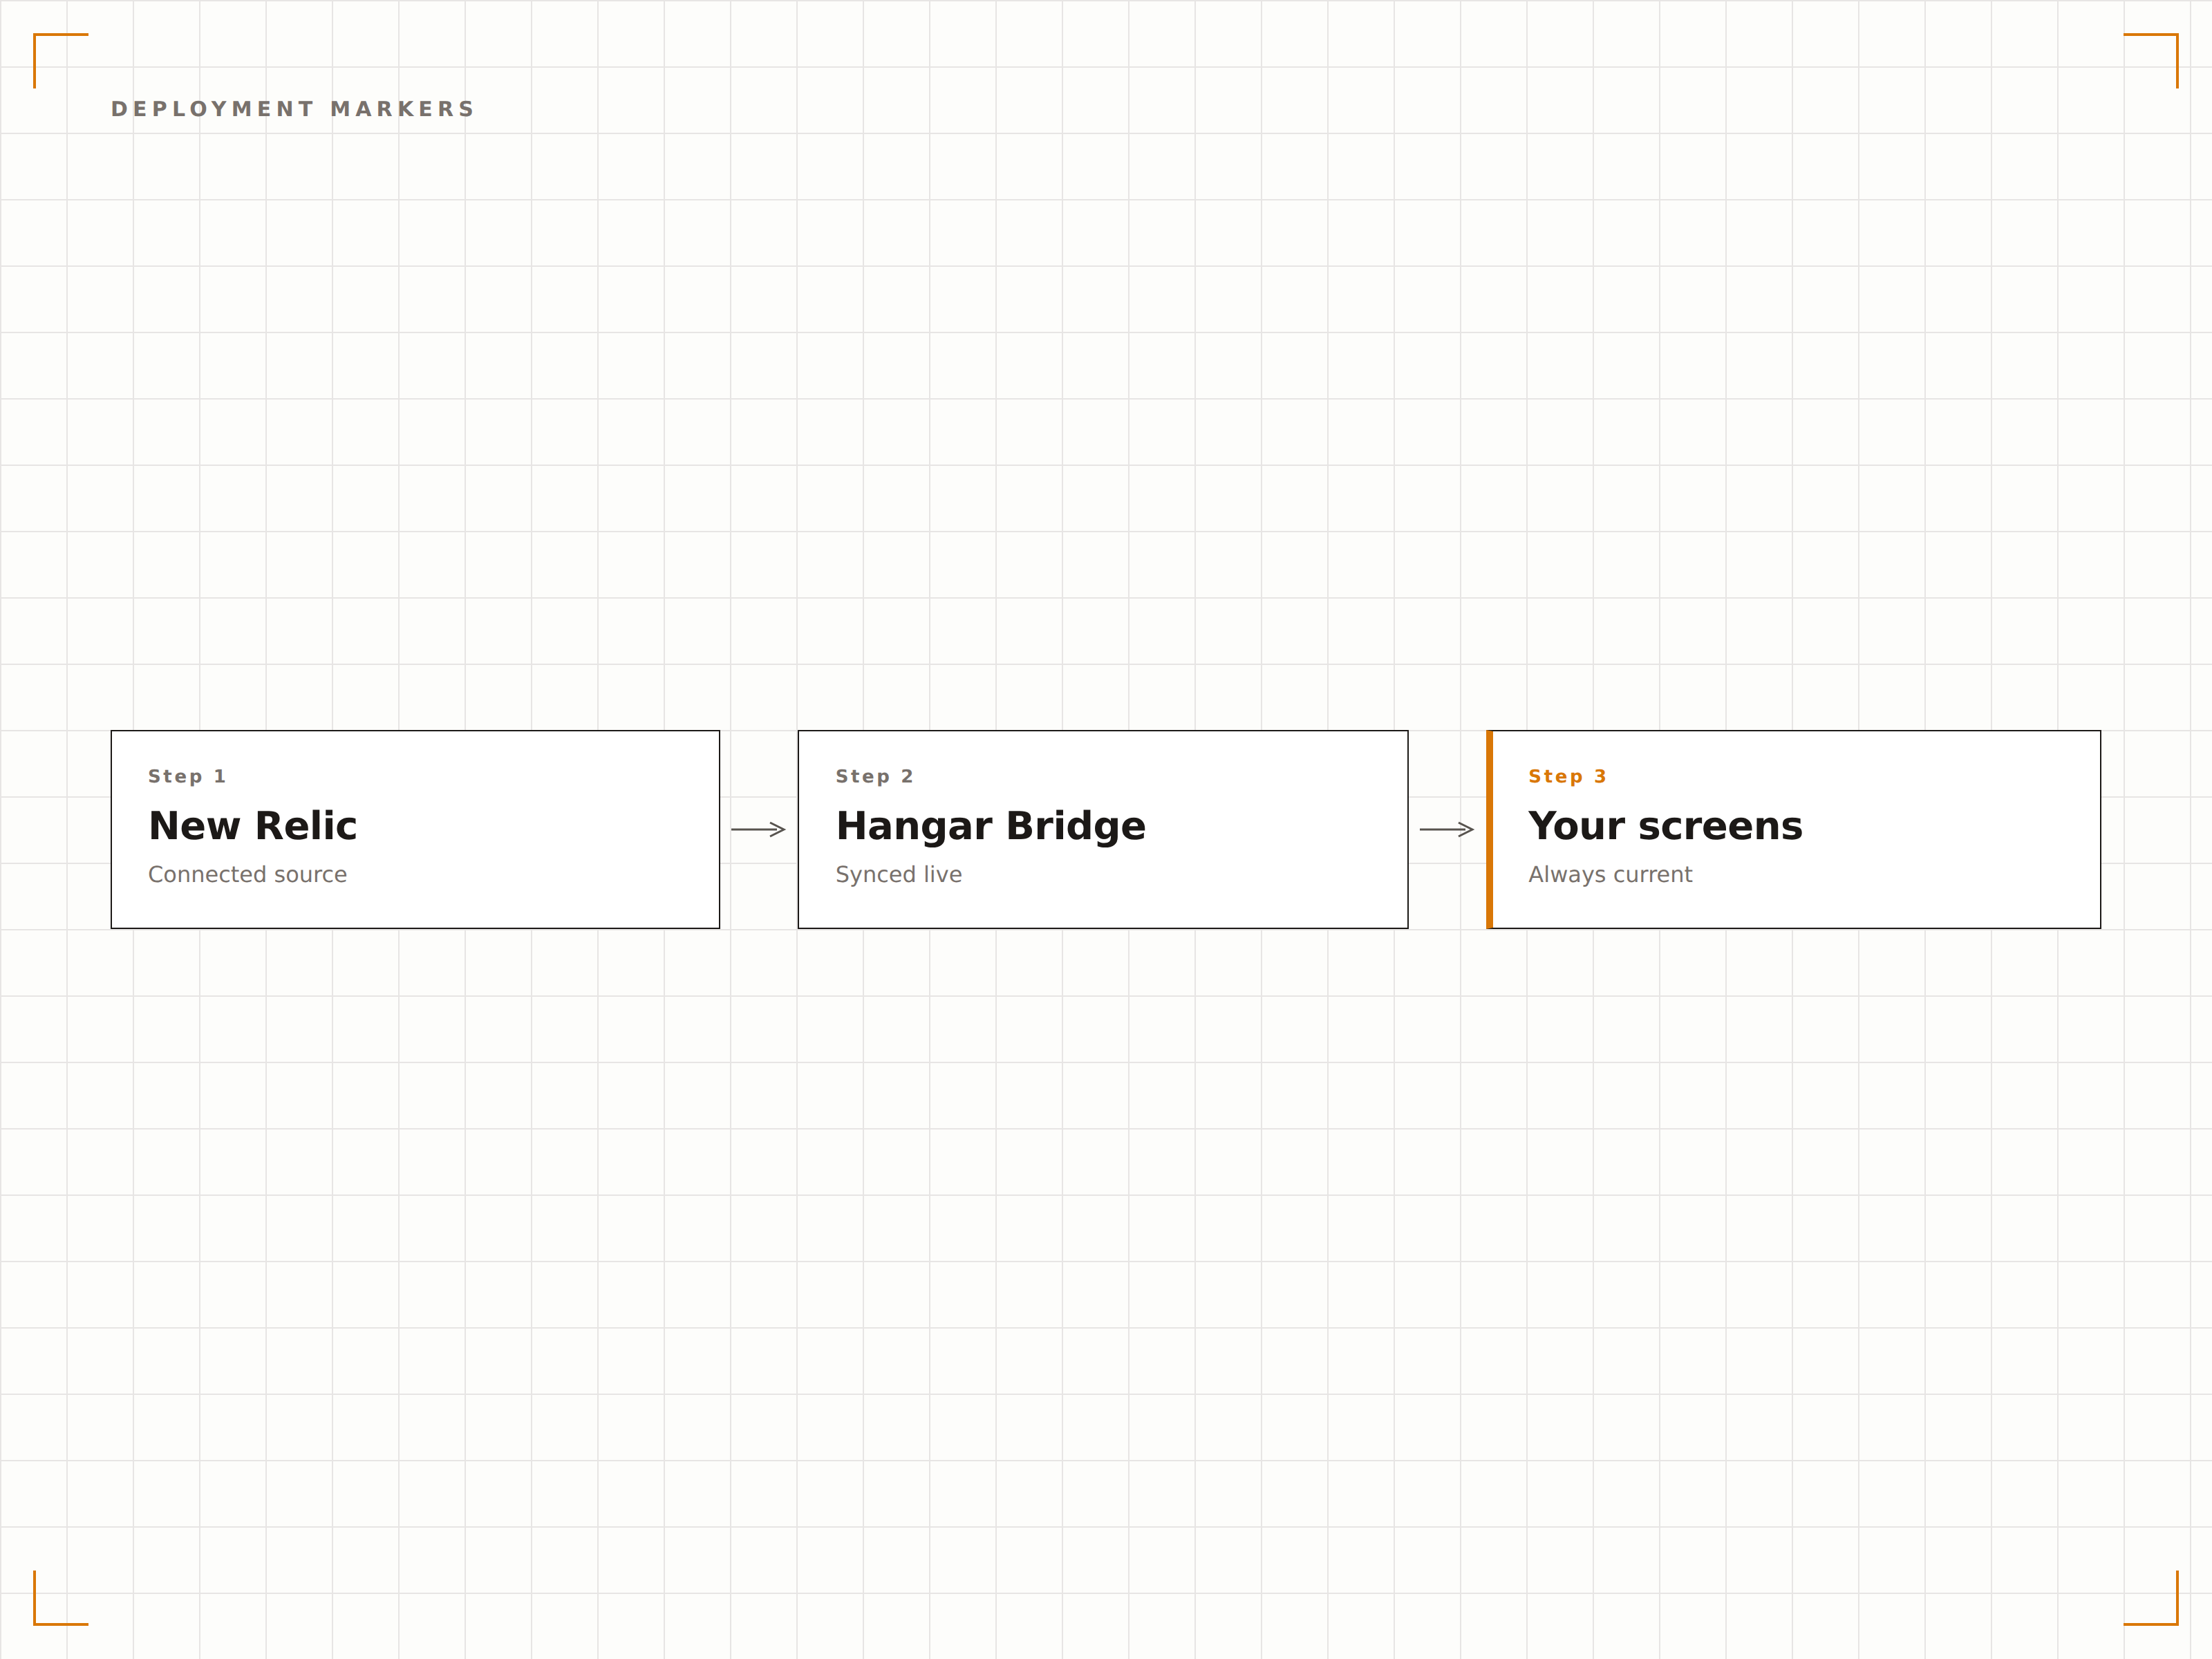
Monitora i Deploy sullo Schermo
I marcatori di deploy di New Relic mostrano quando le modifiche al codice sono state rilasciate. Sugli schermi della segnaletica digitale, questi marcatori compaiono sui grafici temporali così il team può correlare visivamente i deploy con le variazioni di prestazioni in tempo reale.
Vedi l'impatto di ogni deploy, sulla parete.
Marcatori di deploy sui grafici temporali
Correlazione visiva con le variazioni di prestazioni
Visibilità del monitoraggio post-deploy
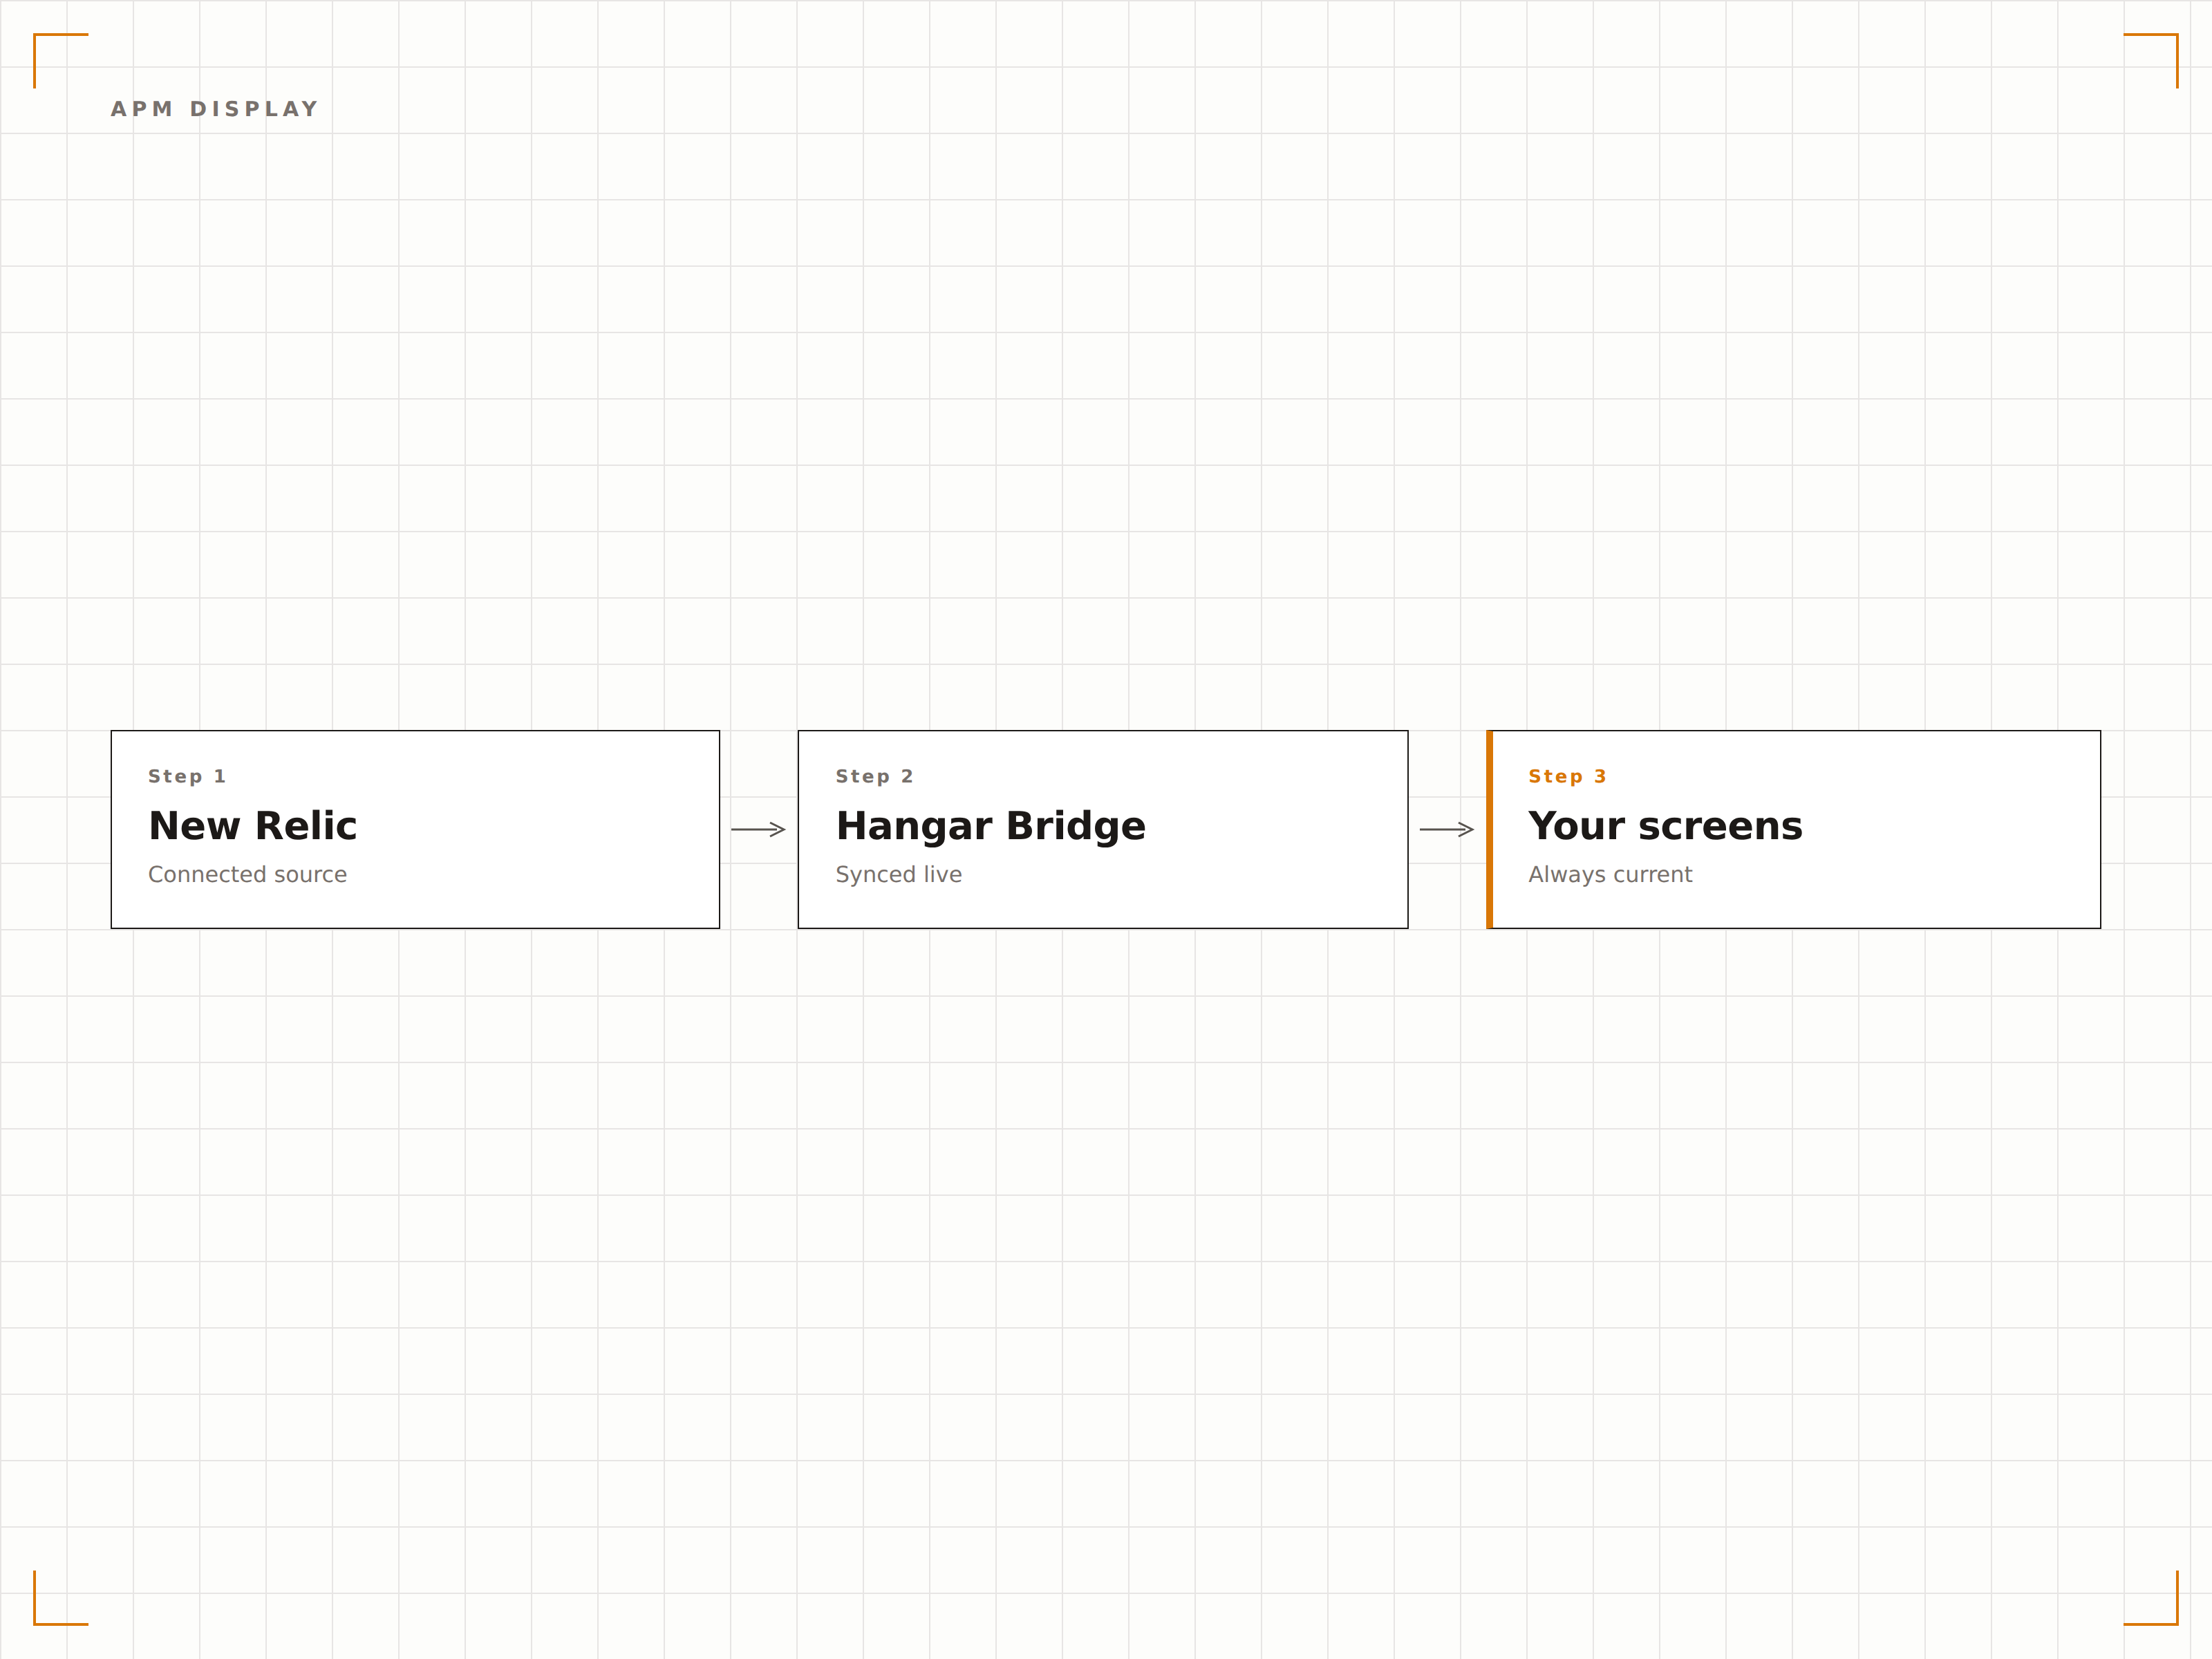
Quattro passaggi verso schermi connessi.
Dalla configurazione ai contenuti live in minuti, non giorni.
Crea Link Pubblici
In New Relic, genera link pubblici per i grafici o URL di condivisione delle dashboard per le viste che desideri visualizzare.
Aggiungi a Hangar.Media
Incolla gli URL dei grafici pubblici di New Relic o i link alle dashboard nel content manager di Hangar.Media.
Configura il Display
Imposta gli intervalli di aggiornamento, la modalità a schermo intero e la rotazione tra più viste di monitoraggio.
Pubblica
Assegna i contenuti di New Relic agli schermi dell'area engineering, alle pareti del NOC o ai display delle sale riunioni.
Costruito per ogni settore.
Scopri come diversi settori utilizzano questa integrazione per ottenere risultati concreti.
Display per il Team di Engineering
Mostra le dashboard delle prestazioni delle applicazioni su uno schermo dedicato nell'area engineering con punteggi Apdex, tassi di errore e cronologia dei deploy.
RetailPannello di Uptime E-Commerce
Visualizza l'uptime del sito, i tempi di caricamento delle pagine e le prestazioni del flusso di checkout sugli schermi nell'area del team operativo e-commerce durante i picchi di traffico.
FinancialAffidabilità della Piattaforma
Mostra le prestazioni di elaborazione delle transazioni, i tempi di risposta delle API e lo stato dei servizi sugli schermi nell'area engineering e operations delle aziende fintech.
EntertainmentSalute della Piattaforma di Ticketing
Monitora le prestazioni della piattaforma di ticketing, la capacità di carico e i tassi di errore sugli schermi durante gli eventi ad alta domanda.
Domande frequenti. Risposte dirette risposte.
Ho bisogno di un account New Relic a pagamento?
New Relic offre un generoso piano gratuito, ma la condivisione pubblica dei grafici e alcune funzionalità delle dashboard potrebbero richiedere un piano a pagamento. Verifica il tuo abbonamento New Relic per assicurarti che le funzionalità di condivisione di cui hai bisogno siano disponibili.
Posso visualizzare gli avvisi di New Relic sullo schermo della segnaletica digitale?
I widget delle condizioni di allerta New Relic e i riepiloghi delle violazioni compaiono nelle dashboard. Se la tua dashboard include grafici relativi agli avvisi, verranno visualizzati sullo schermo della segnaletica digitale con gli stati di allerta aggiornati.
Come funziona l'aggiornamento per il monitoraggio in tempo reale?
Hangar.Media ricarica l'embed di New Relic all'intervallo da te scelto. Per un monitoraggio quasi in tempo reale, imposta l'aggiornamento ogni 10-30 secondi. La granularità dei dati dipende dalle impostazioni di conservazione dei dati e delle query di New Relic.
Posso mostrare un solo grafico invece di una dashboard completa?
Sì. New Relic ti consente di generare link pubblici per singoli grafici. Puoi visualizzare un singolo indicatore Apdex, un grafico del throughput o un grafico del tasso di errore sullo schermo della segnaletica digitale per una visione mirata.
Un prezzo. L'intera piattaforma.
Così pensiamo che la segnaletica digitale dovrebbe funzionare. Editor di contenuti, gestione degli schermi e oltre 200 integrazioni di app — tutto incluso fin dal primo giorno.