I dati di vendita Putler, a portata di sguardo. sul muro.
Visualizza le analisi e-commerce di Putler, i dashboard di vendita e i dati sui clienti su schermi di segnaletica digitale per offrire a tutto il team una visibilità completa sulle performance del negozio.
E-Commerce Intelligence sullo Schermo
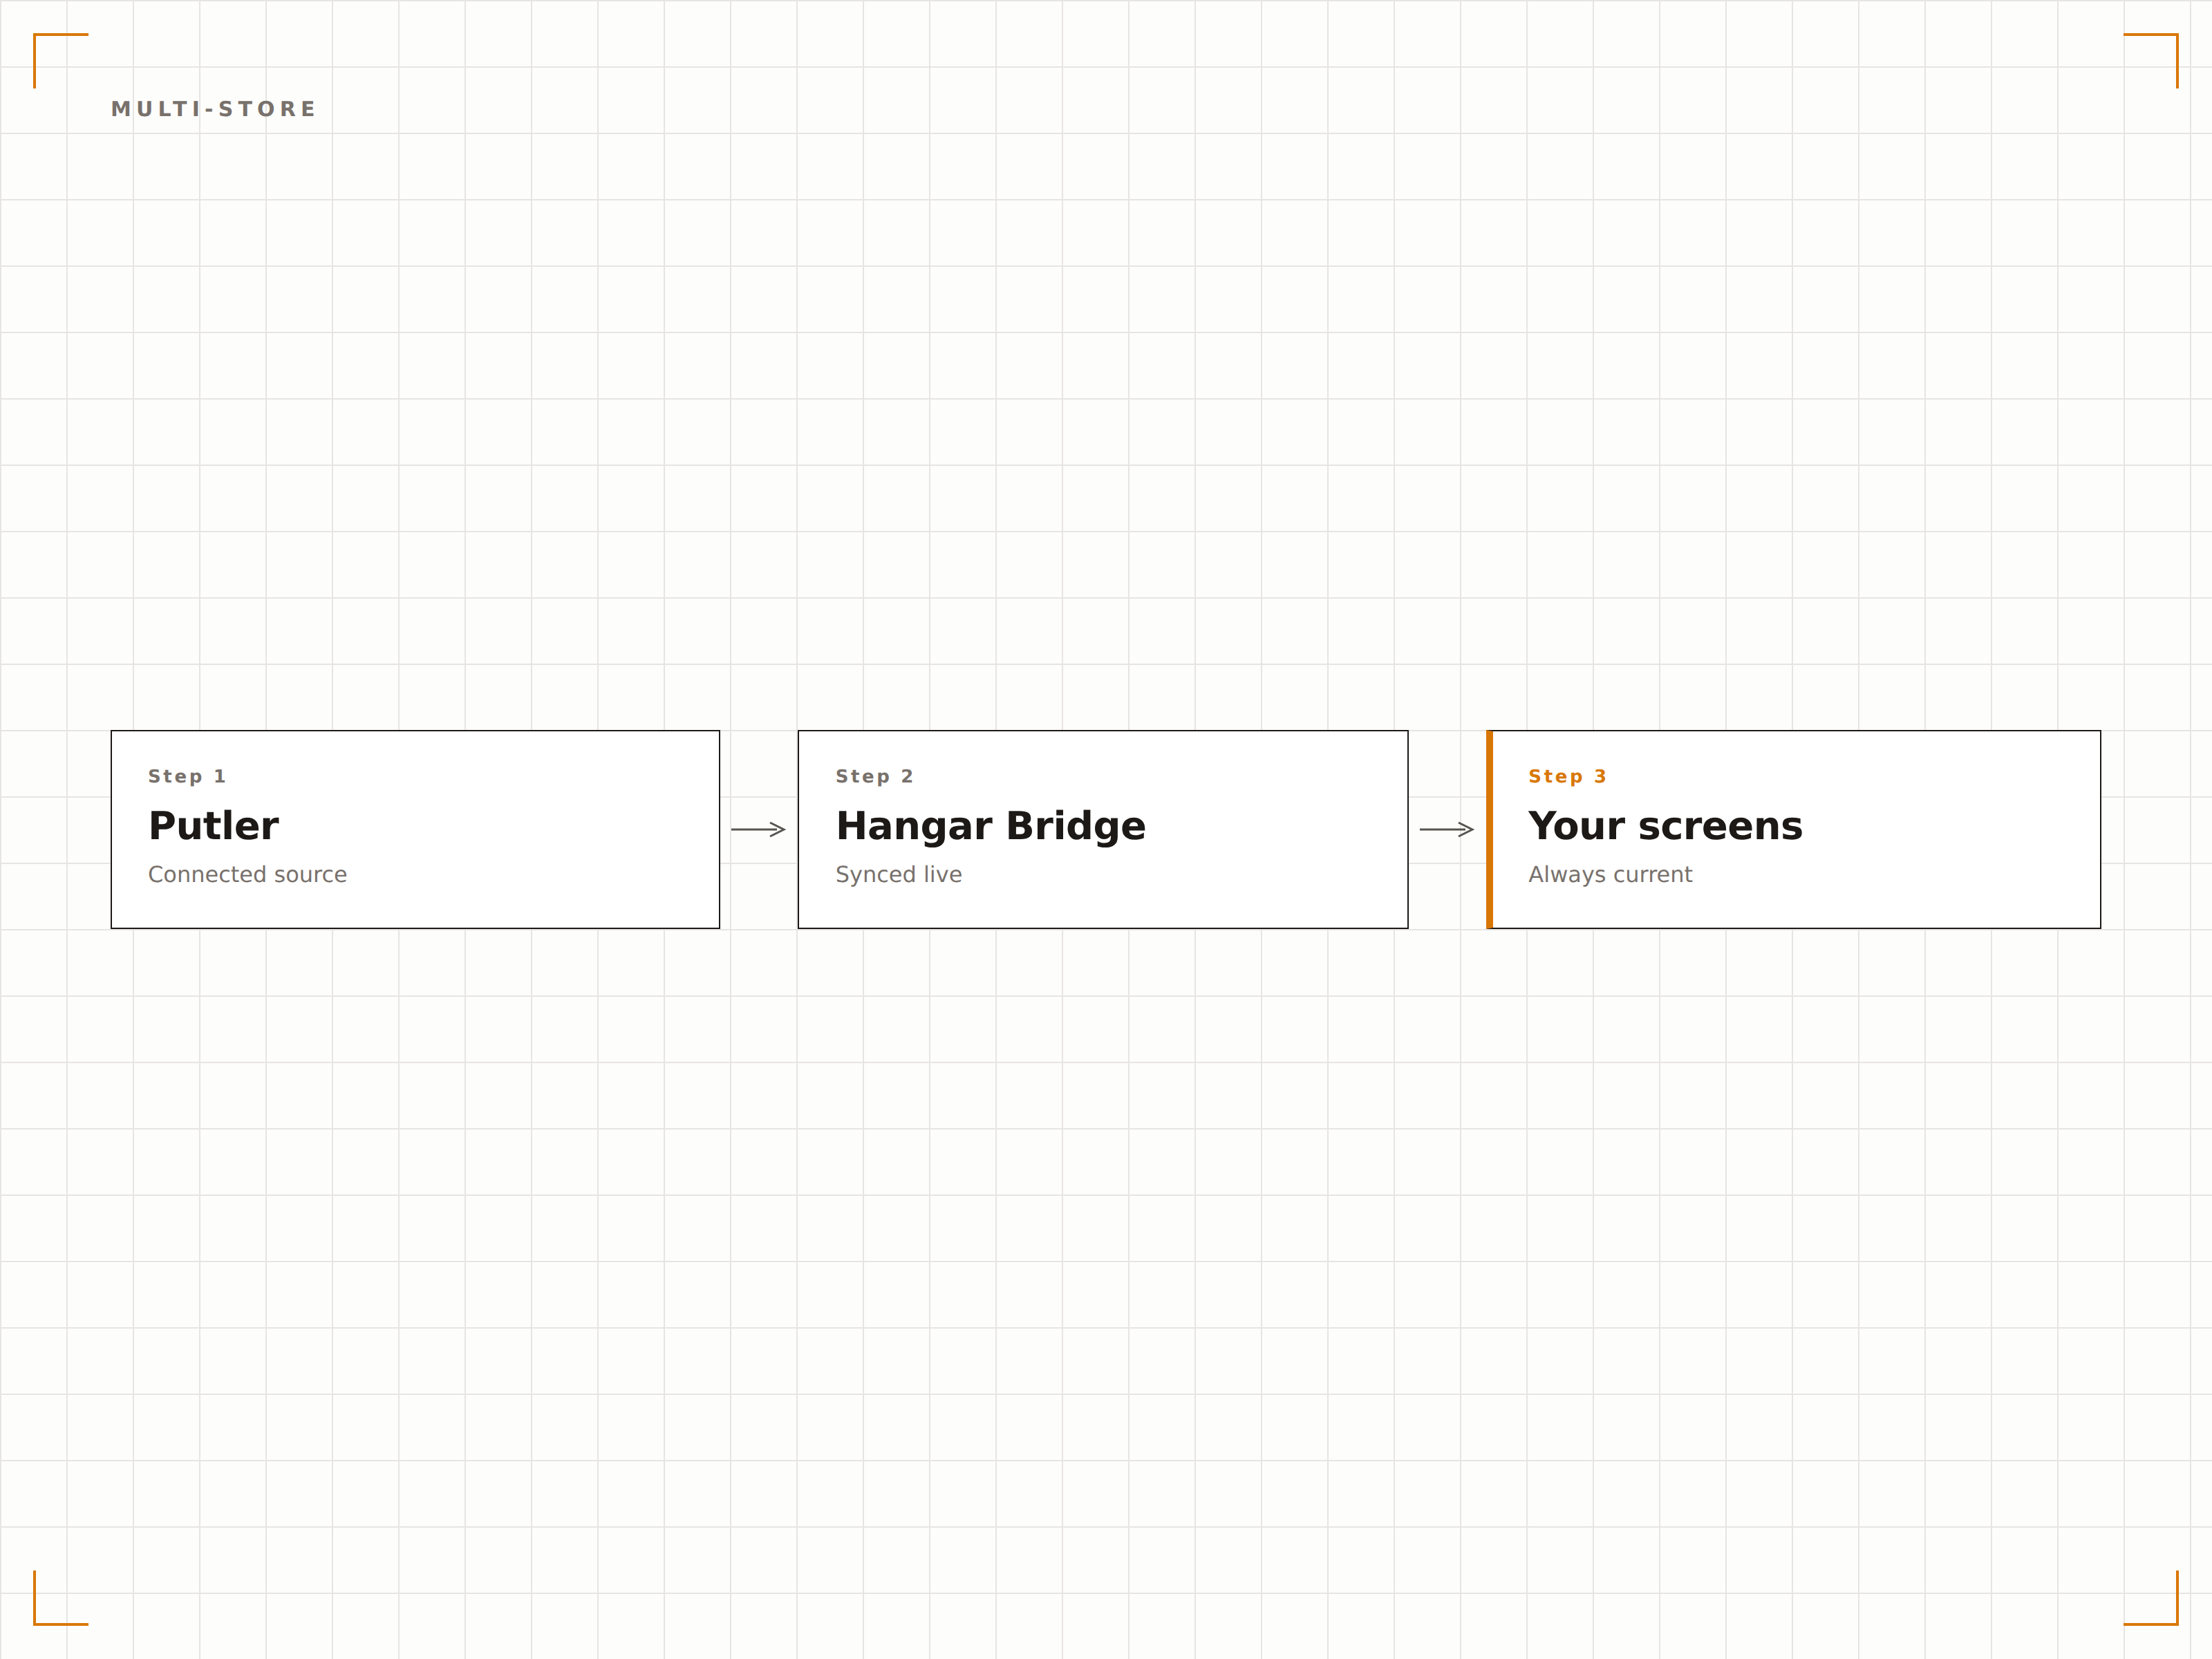
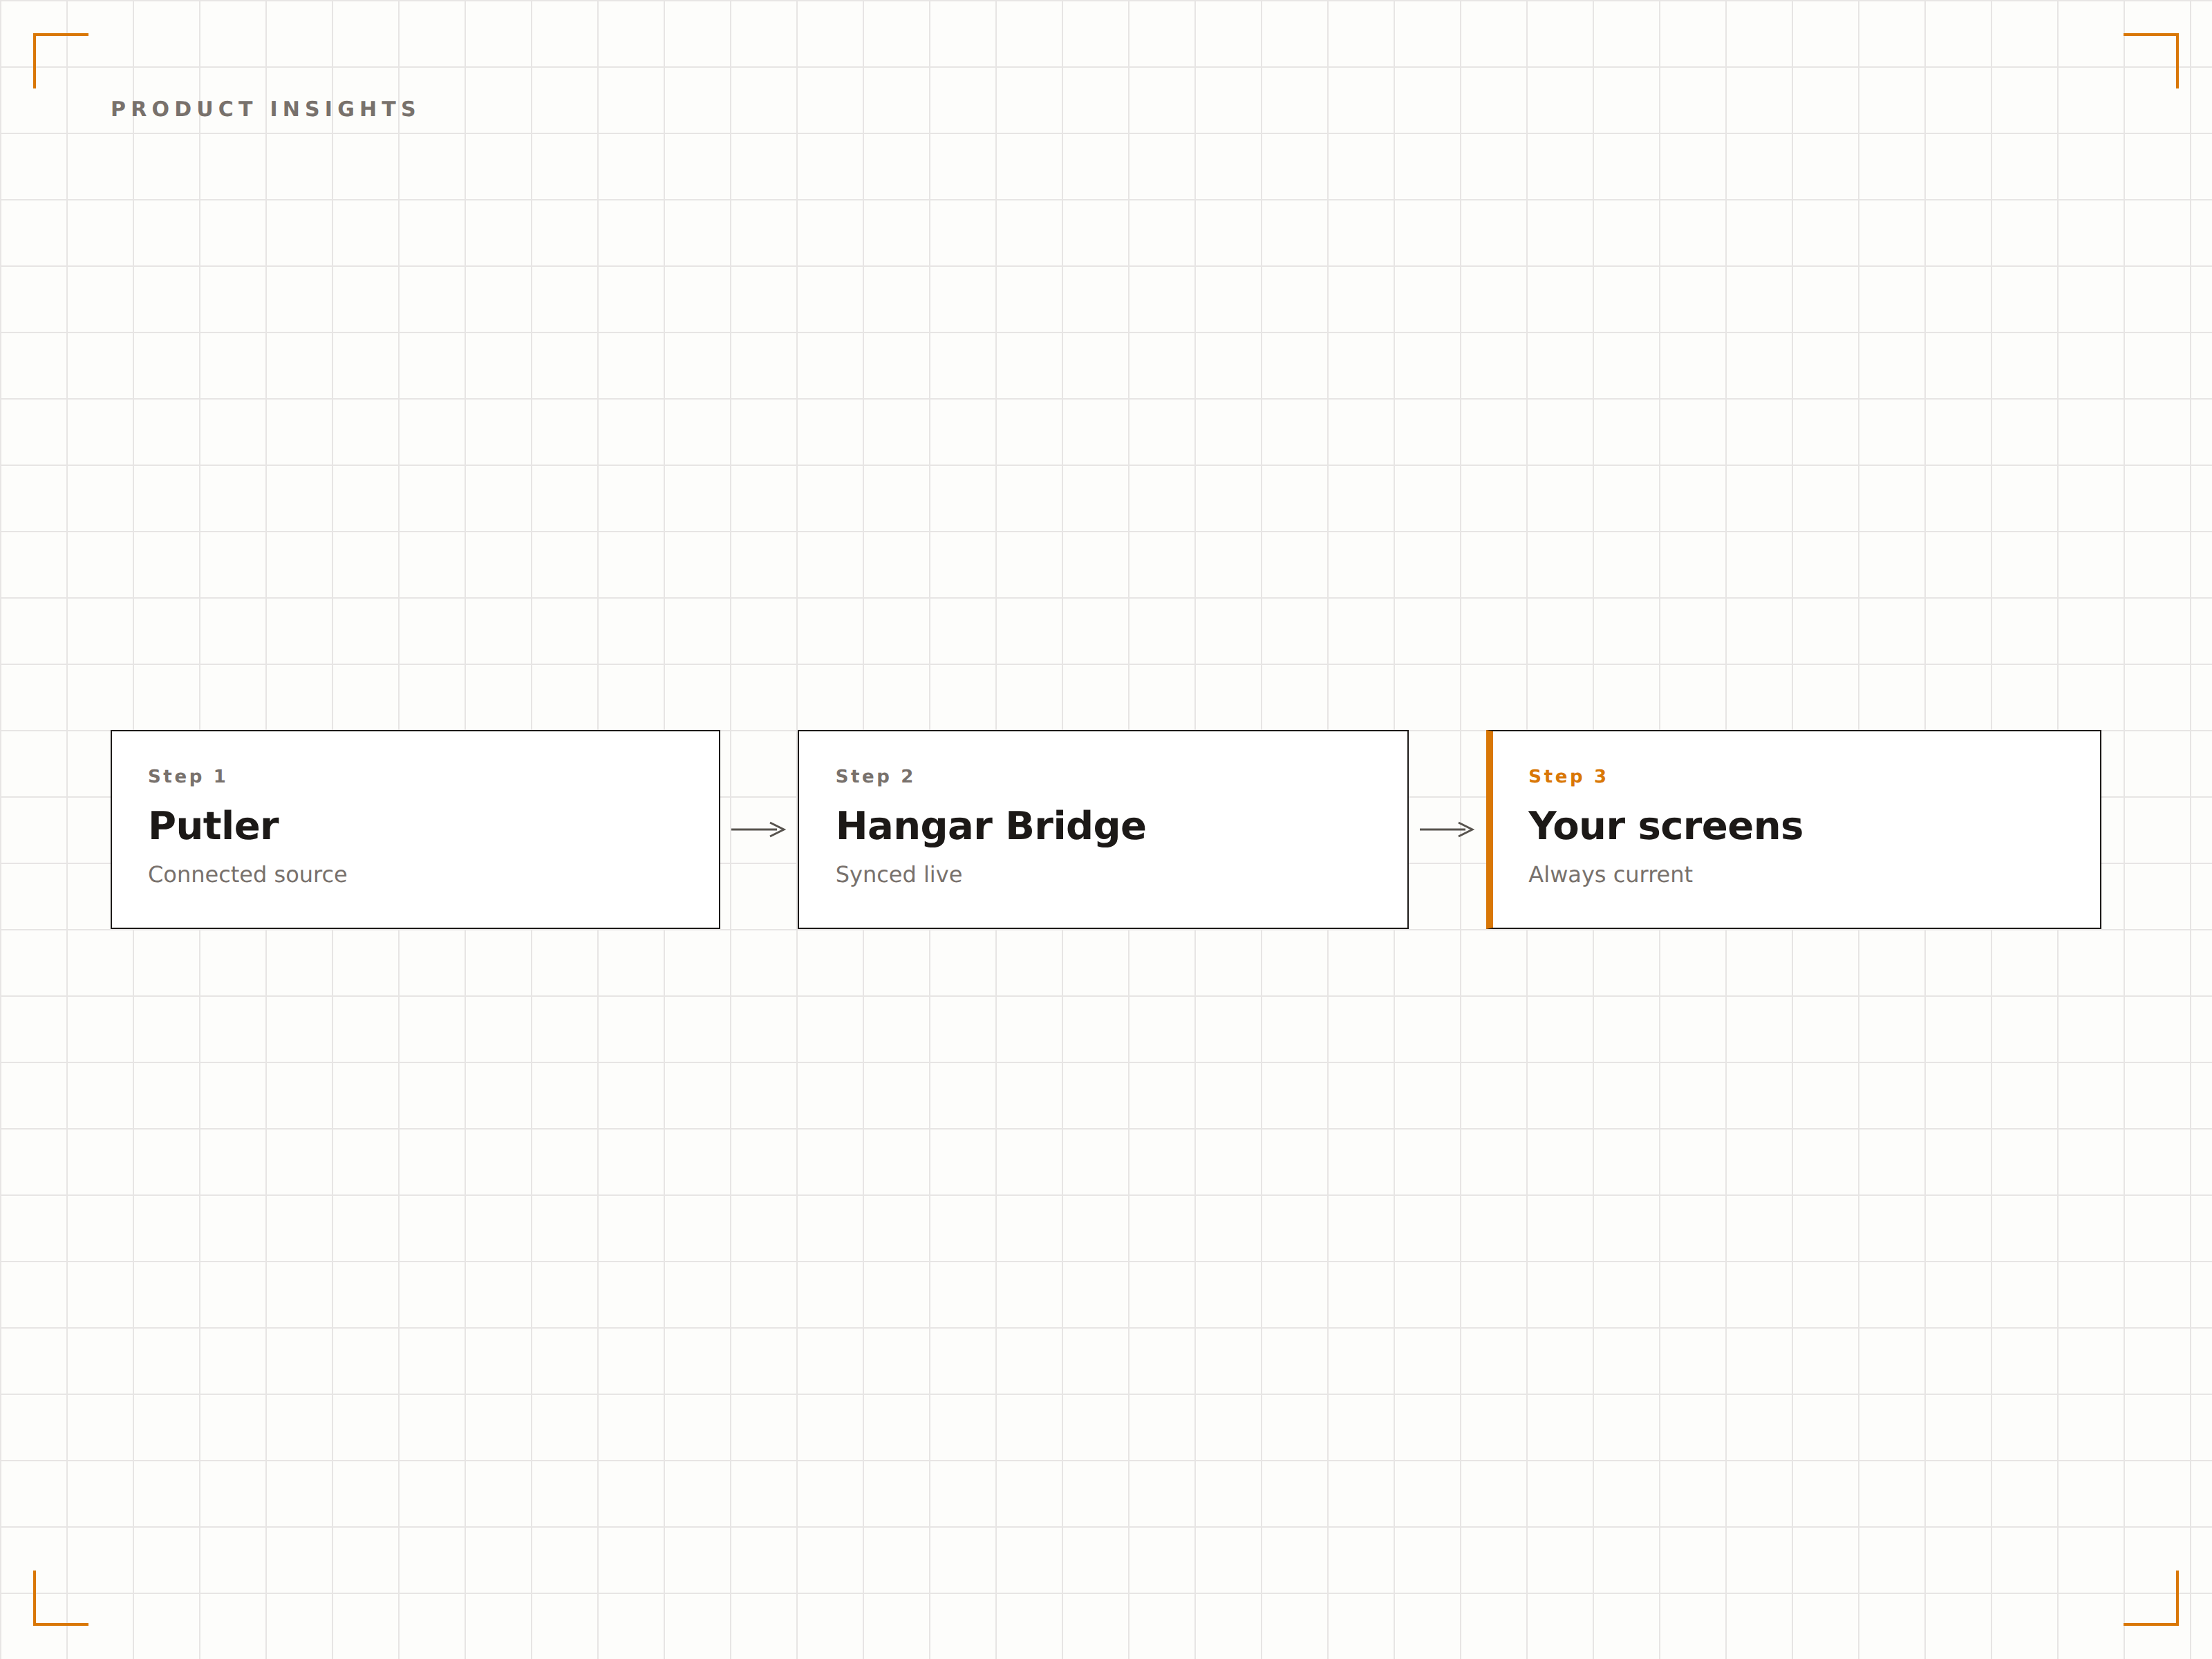
Putler aggrega i dati di vendita da più gateway di pagamento e piattaforme e-commerce in un unico dashboard di analisi. Hangar.Media visualizza i dashboard di Putler su schermi di segnaletica così il tuo team può monitorare le vendite giornaliere, le performance dei prodotti, i segmenti di clientela e i trend di fatturato senza dover accedere a piattaforme separate. Un solo schermo, tutti i tuoi store.
Cosa puoi fare con sul muro.
Tre funzionalità che rendono questa integrazione indispensabile per la tua rete di segnaletica digitale.
Tutti i Negozi in un'Unica Vista
Putler aggrega i dati di più gateway di pagamento e piattaforme e-commerce. Mostra una vista di vendita unificata su schermi di segnaletica digitale, combinando i dati di Stripe, PayPal, WooCommerce e Shopify in un'unica dashboard.
Ogni negozio, ogni gateway, un unico schermo.
Aggregazione dati multi-gateway
Fatturato unificato su tutte le piattaforme
Dashboard unica per tutti i negozi
Performance di Prodotto in Evidenza
Mostra su schermi di segnaletica digitale i prodotti più venduti, le analisi per categoria e i dati sui movimenti di magazzino. I team di magazzino e di evasione ordini vedono quali prodotti si vendono più rapidamente, mentre i team marketing vedono quali promozioni stanno funzionando.
Le performance di prodotto visibili a ogni team che ne ha bisogno.
Classifiche dei prodotti più venduti
Analisi del fatturato per categoria di prodotto
Monitoraggio della velocità di vendita
Analisi RFM sullo Schermo
L'analisi RFM (Recency, Frequency, Monetary) di Putler segmenta automaticamente i tuoi clienti. Mostra questi segmenti su schermi di segnaletica digitale affinché i team di marketing e customer success possano vedere a colpo d'occhio la distribuzione di clienti fedeli, a rischio e nuovi.
I segmenti di salute della clientela visibili all'intero team.
Visualizzazione della segmentazione clienti RFM
Conteggio di clienti fedeli, a rischio e nuovi
Andamento dei segmenti nel tempo

Quattro passaggi verso schermi connessi.
Dalla configurazione ai contenuti live in minuti, non giorni.
Collega le Fonti di Pagamento
Assicurati che Putler sia connesso ai tuoi gateway di pagamento e alle piattaforme e-commerce con la sincronizzazione dei dati di vendita attiva.
Configura la Dashboard
Configura la tua dashboard Putler con le metriche di vendita, le visualizzazioni di prodotto e i segmenti di clientela che desideri mostrare.
Aggiungi a Hangar.Media
Utilizza la funzione Dashboard Autenticate di Hangar.Media per connettere la tua dashboard Putler alla segnaletica digitale.
Pubblica
Assegna agli schermi del tuo ufficio, magazzino o centro di evasione ordini e i dati e-commerce vanno in diretta.
Costruito per ogni settore.
Scopri come diversi settori utilizzano questa integrazione per ottenere risultati concreti.
E-Commerce War Room
Mostra su schermi nell'area del team e-commerce i dati di vendita unificati di tutti i gateway di pagamento durante i periodi di picco commerciale e gli eventi promozionali.
CorporateVisibilità sul Fatturato
Mostra i totali di vendita giornalieri e i trend di fatturato su uno schermo nell'area principale dell'ufficio per una trasparenza aziendale sulle performance e-commerce.
HospitalityMonitoraggio delle Vendite di Merchandising
Mostra i dati sul merchandising e sui ricavi accessori da negozi online e fisici su schermi back-of-house nelle aree di gestione della venue.
EntertainmentPerformance del Merchandising
Mostra le vendite di merchandising per prodotto, evento e piattaforma su schermi nell'area del team merchandising per il monitoraggio delle performance in tempo reale.
Domande frequenti. Risposte dirette risposte.
Quali gateway di pagamento supporta Putler?
Putler supporta Stripe, PayPal, WooCommerce, Shopify, BigCommerce, Braintree, Authorize.net e oltre 17 altri gateway di pagamento e piattaforme e-commerce. Tutti i dati connessi sono disponibili per la visualizzazione sugli schermi di Hangar.Media.
Posso visualizzare i dati di più negozi su un unico schermo?
Sì. Putler aggrega i dati di tutti i negozi e gateway connessi in dashboard unificate. Lo schermo di segnaletica digitale mostra il fatturato combinato, oppure è possibile filtrare per singolo negozio o gateway.
Quanto sono in tempo reale i dati di vendita?
Putler si sincronizza con i gateway di pagamento più volte nel corso della giornata. Lo schermo di segnaletica digitale si aggiorna all'intervallo da te scelto. I totali di vendita giornalieri sono in genere aggiornati entro poche ore dalle transazioni effettive.
Posso visualizzare Putler insieme ad altri strumenti di analisi?
Sì. Le dashboard di Putler possono essere aggiunte a qualsiasi playlist di Hangar.Media insieme a Baremetrics, ChartMogul, Google Analytics e altri tipi di contenuto, per una rotazione analitica completa.
Un prezzo. L'intera piattaforma.
Così pensiamo che la segnaletica digitale dovrebbe funzionare. Editor di contenuti, gestione degli schermi e oltre 200 integrazioni di app — tutto incluso fin dal primo giorno.