I dati di errore Sentry sempre visibili.
Mostra dashboard di error tracking Sentry, trend delle problematiche e metriche di salute delle release su schermi di segnaletica digitale per mantenere il team di sviluppo sempre aggiornato.
Monitoraggio degli Errori a Vista di Tutti
Sentry registra ogni errore e problema di performance nelle tue applicazioni. Hangar.Media porta quei dati su schermi condivisi, così il tuo team di sviluppo può monitorare i tassi di errore, lo stato delle release e i trend delle problematiche senza dover controllare continuamente la posta in arrivo. Mostra conteggi delle problematiche, tassi di sessioni senza crash e grafici sulla frequenza degli errori sugli schermi nell'area di sviluppo.
Cosa puoi fare con sempre visibili.
Tre funzionalità che rendono questa integrazione indispensabile per la tua rete di segnaletica digitale.
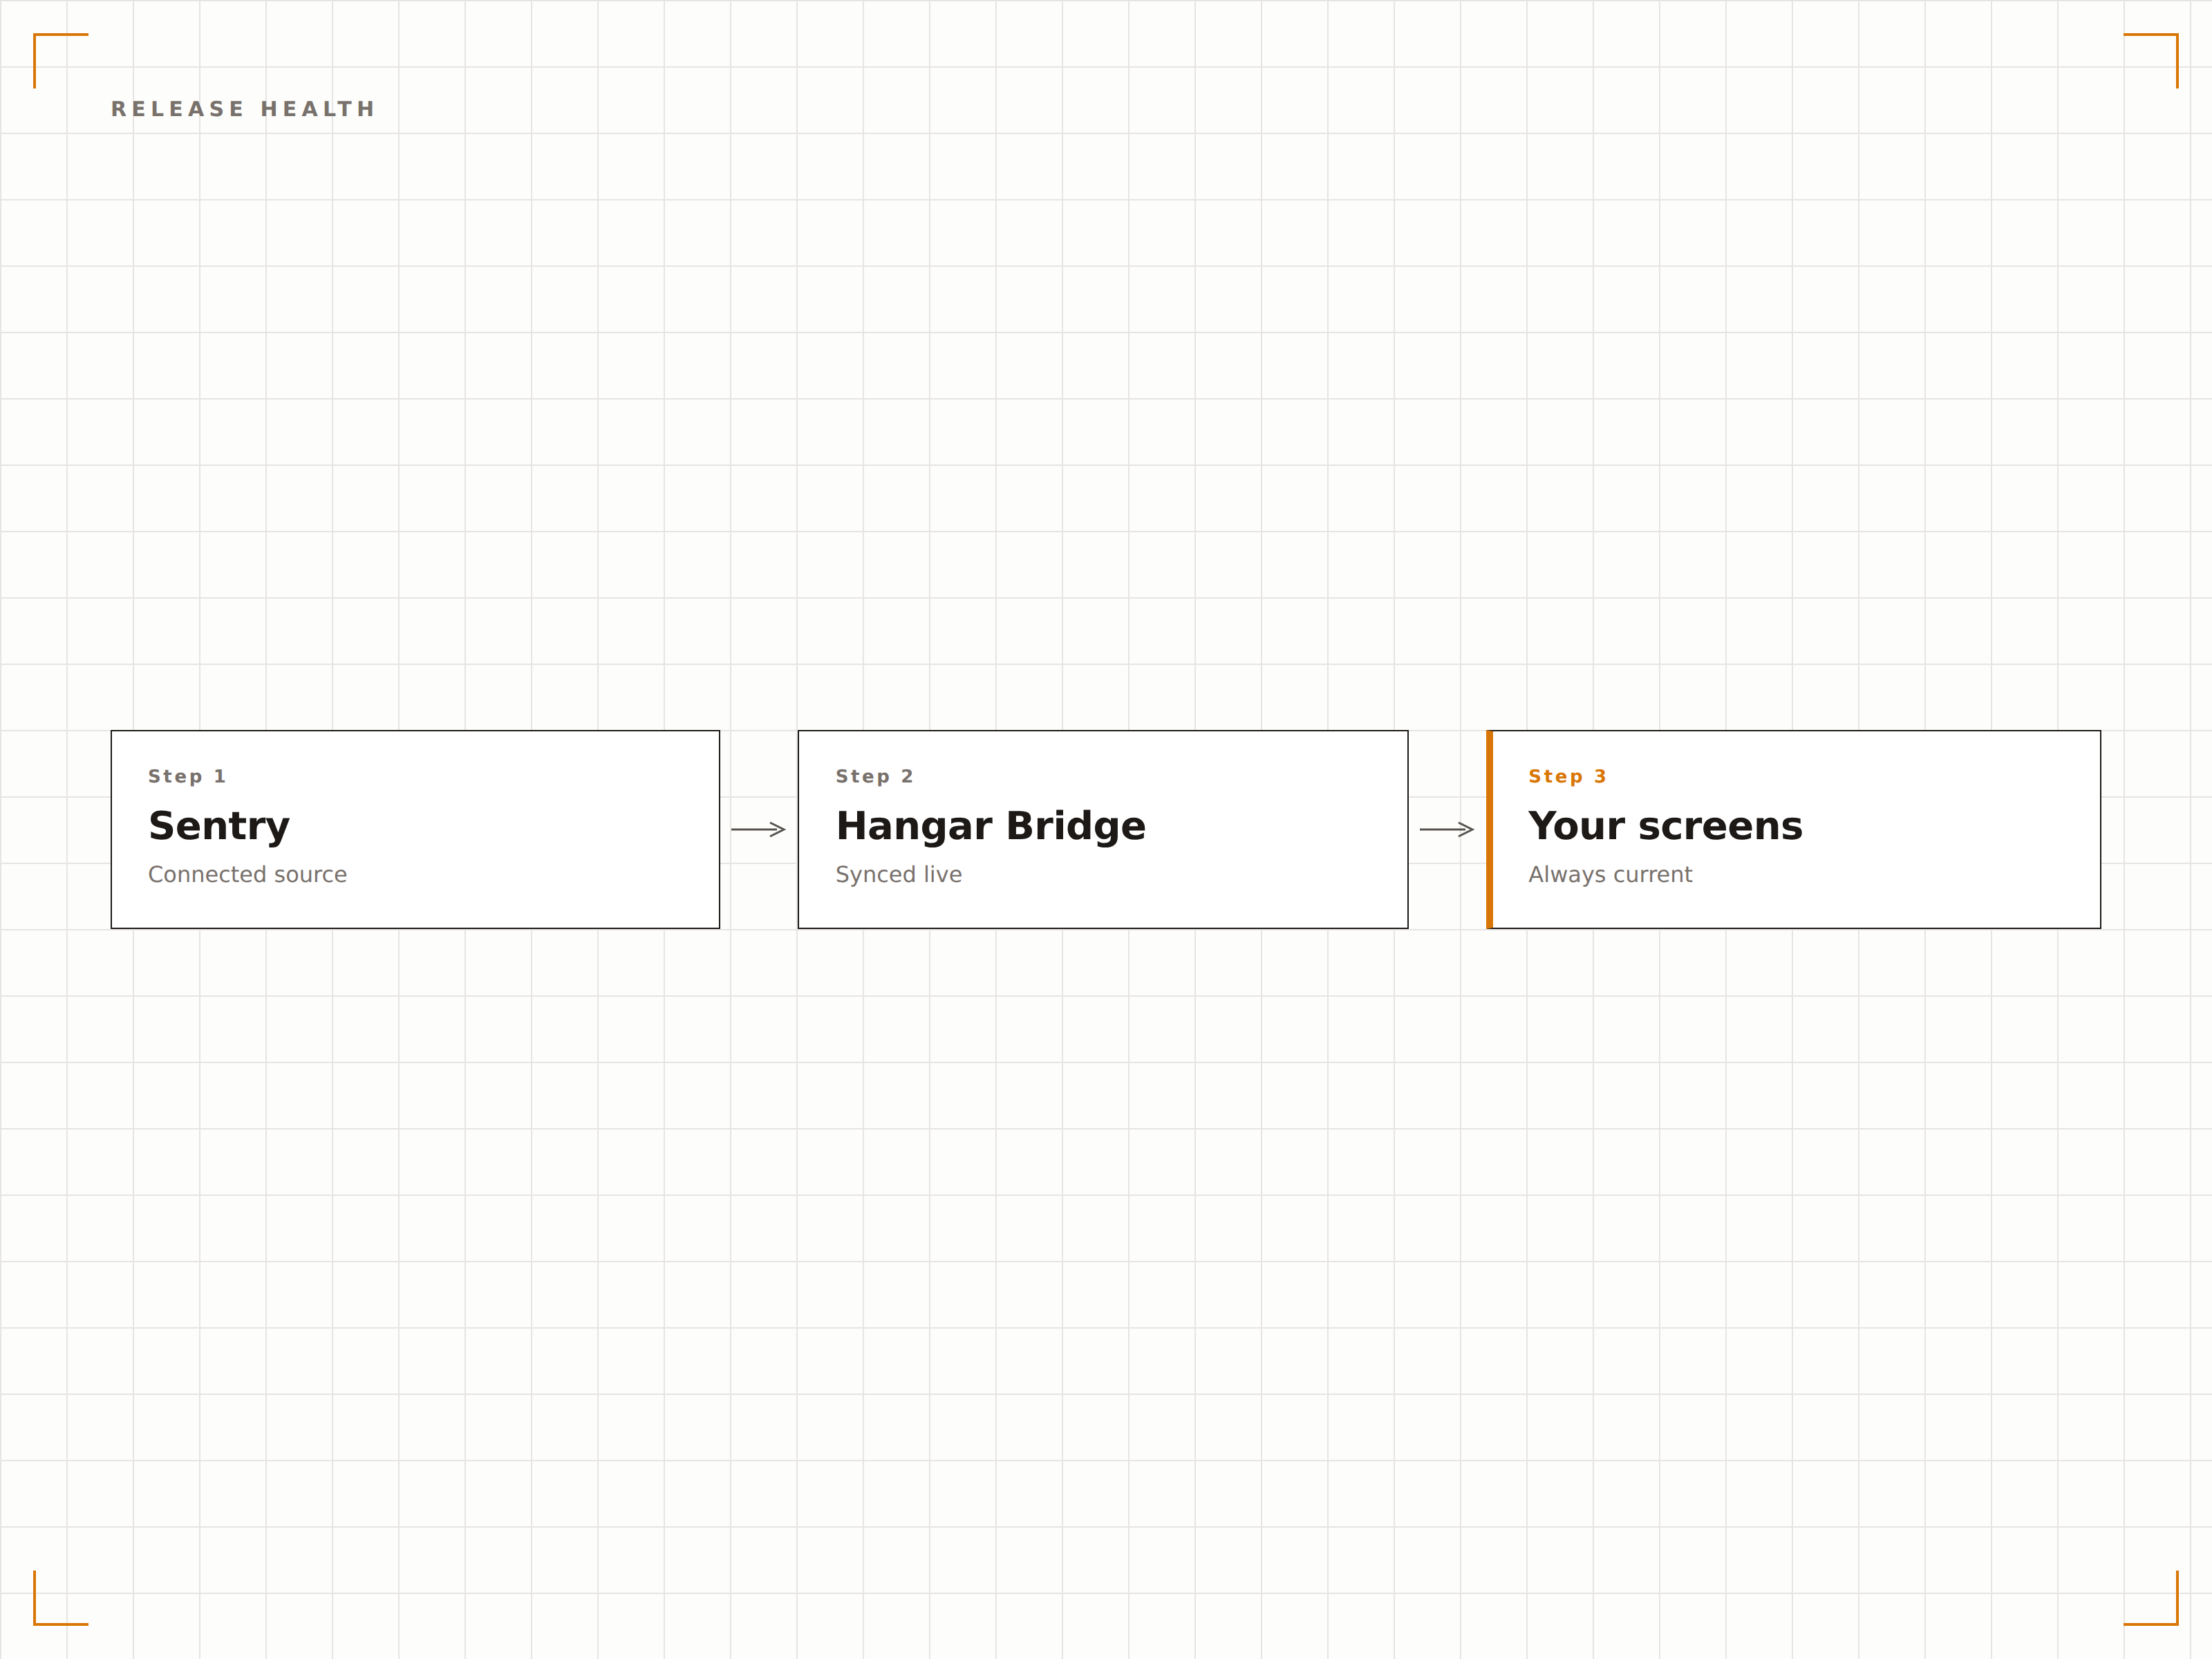
Monitora la Qualità delle Release sullo Schermo
Mostra i dati sulla salute delle release di Sentry sugli schermi di segnaletica digitale: tassi di sessioni senza crash, percentuali di adozione e conteggi delle regressioni per le ultime distribuzioni. Il team ha sempre sott'occhio la qualità delle release.
Ogni release, verificata sulla parete.
Visualizzazione del tasso di sessioni senza crash
Monitoraggio dell'adozione delle release
Visibilità sul rilevamento delle regressioni
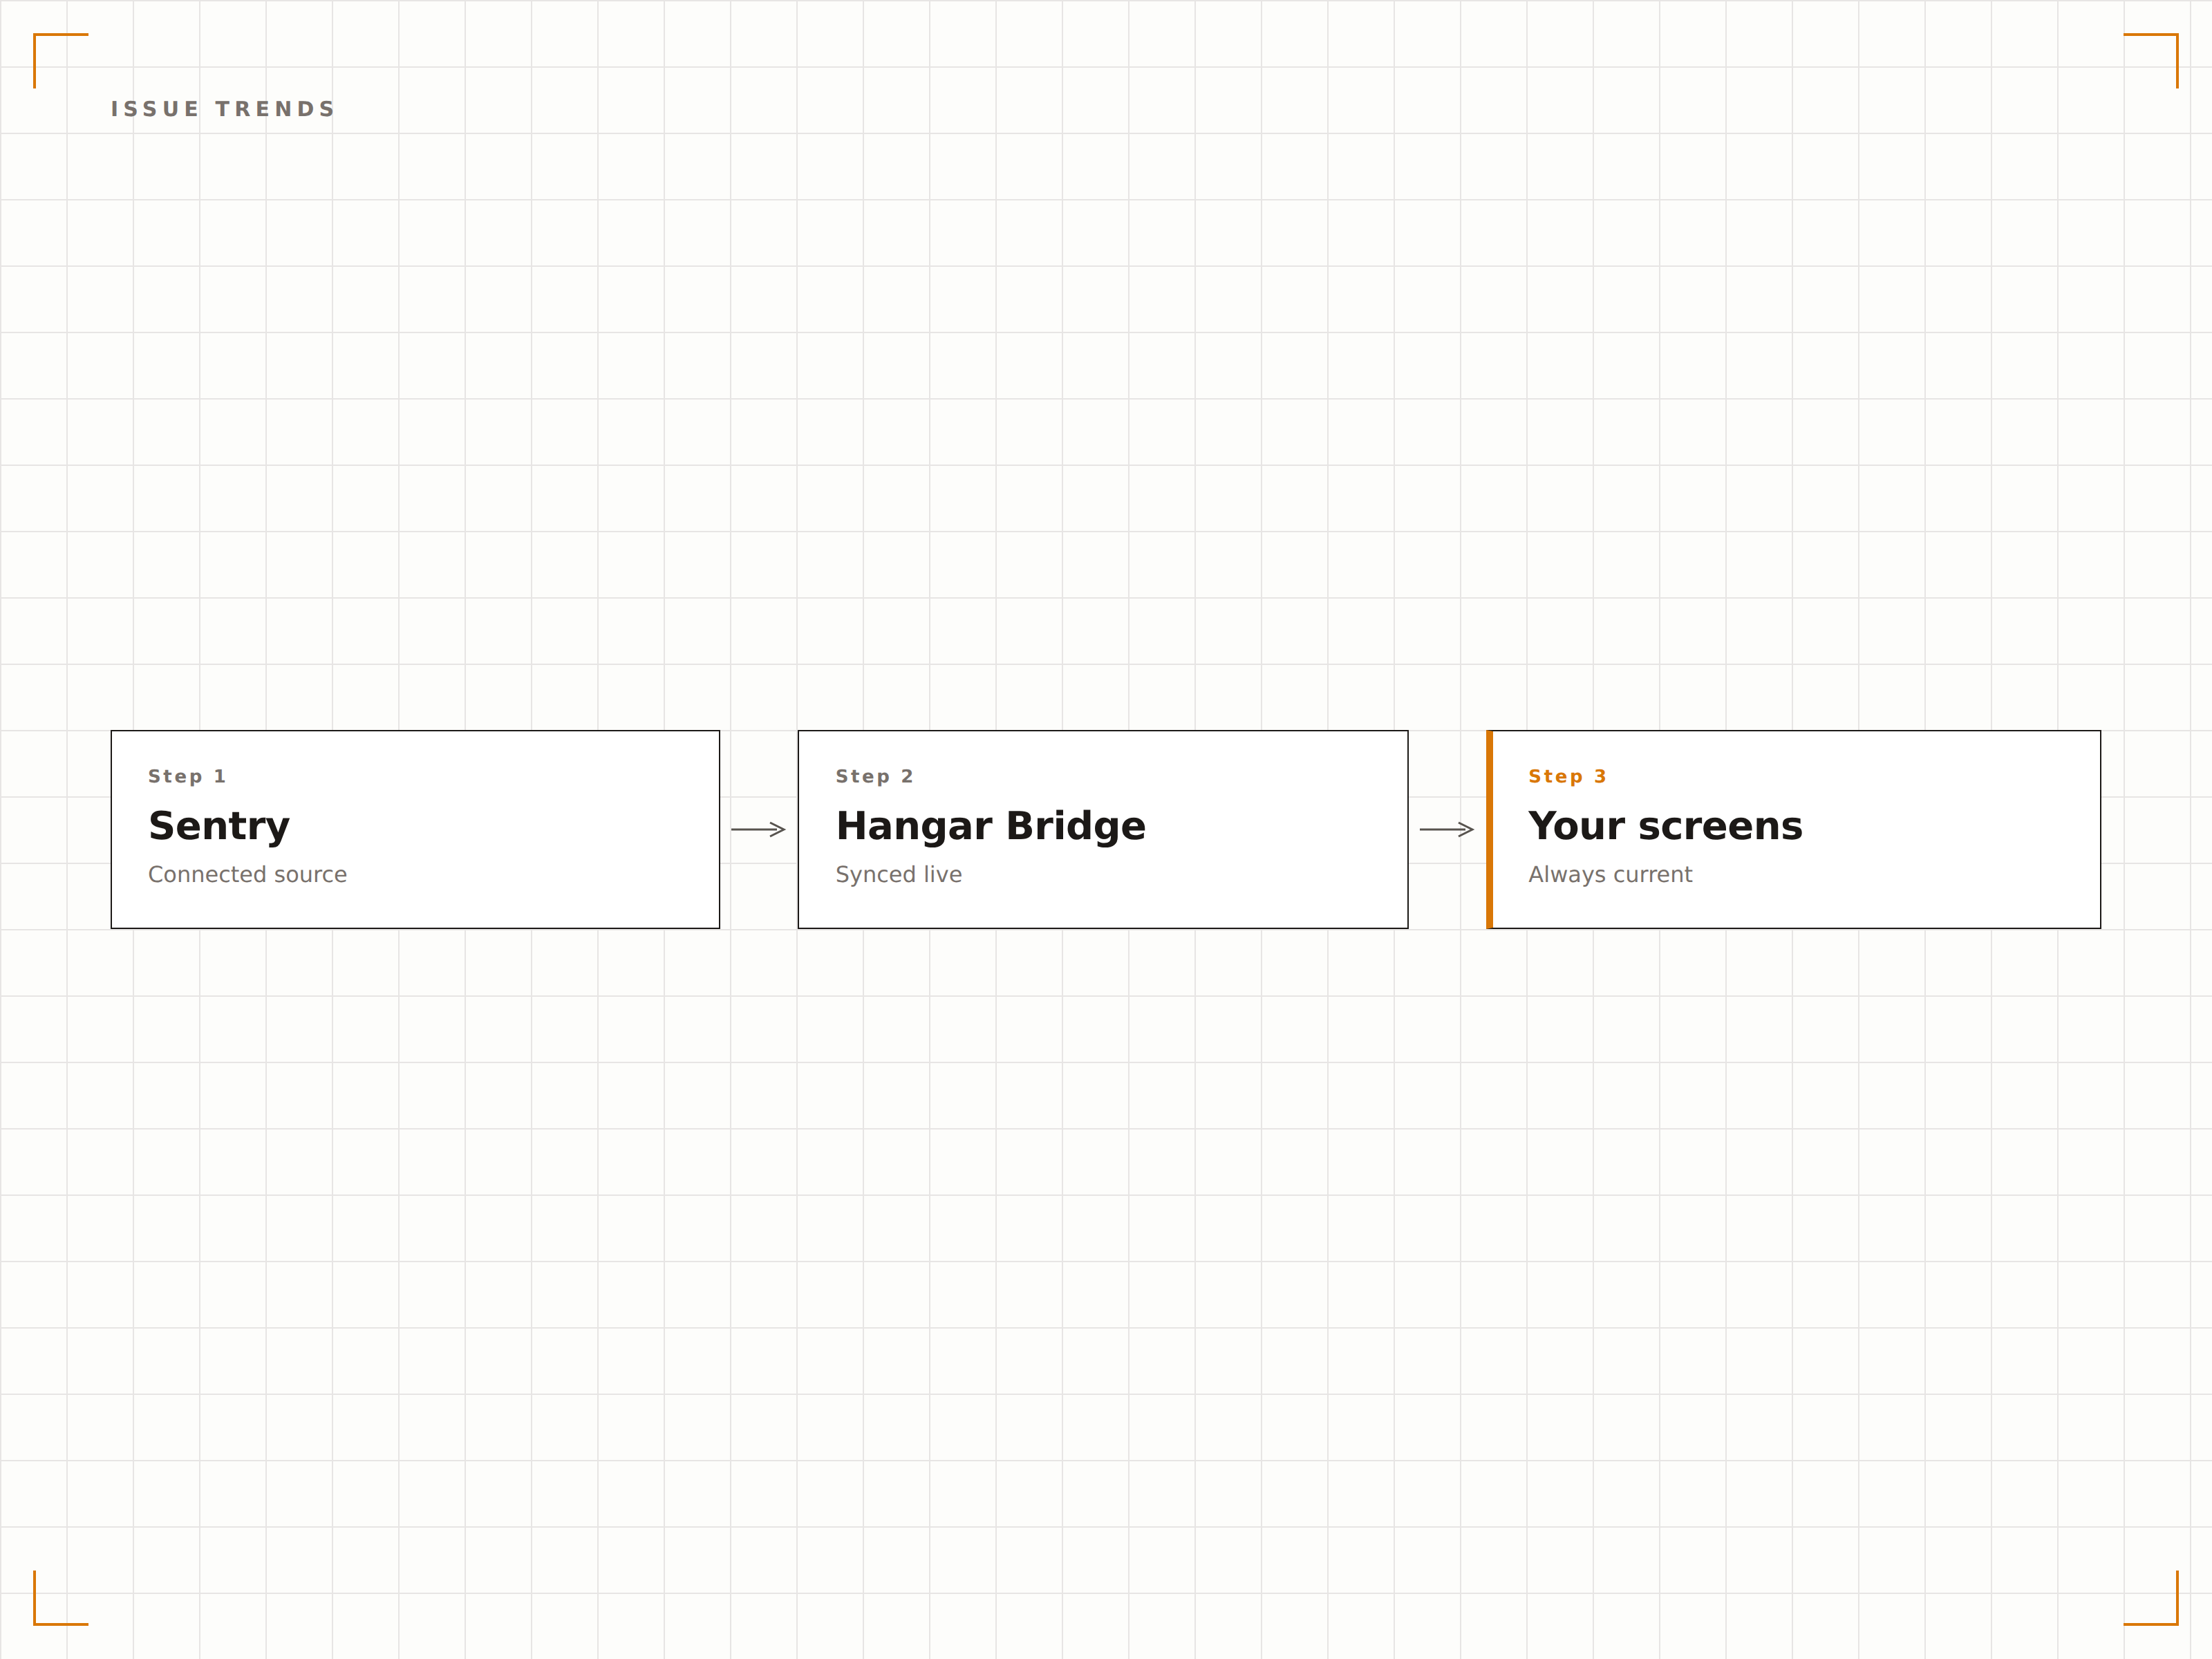
Monitoraggio della Frequenza degli Errori
Mostra i trend di frequenza degli errori nel tempo sugli schermi di segnaletica digitale. Quando una nuova issue registra un picco, la linea di trend sullo schermo lo rende immediatamente evidente al team. Abbinalo ai marker di deployment per correlare gli errori con le release recenti.
Individua i picchi di errori prima che diventino interruzioni del servizio.
Grafici di trend sulla frequenza degli errori
Visualizzazione del numero di issue nel tempo
Rilevamento dei picchi visibile al team
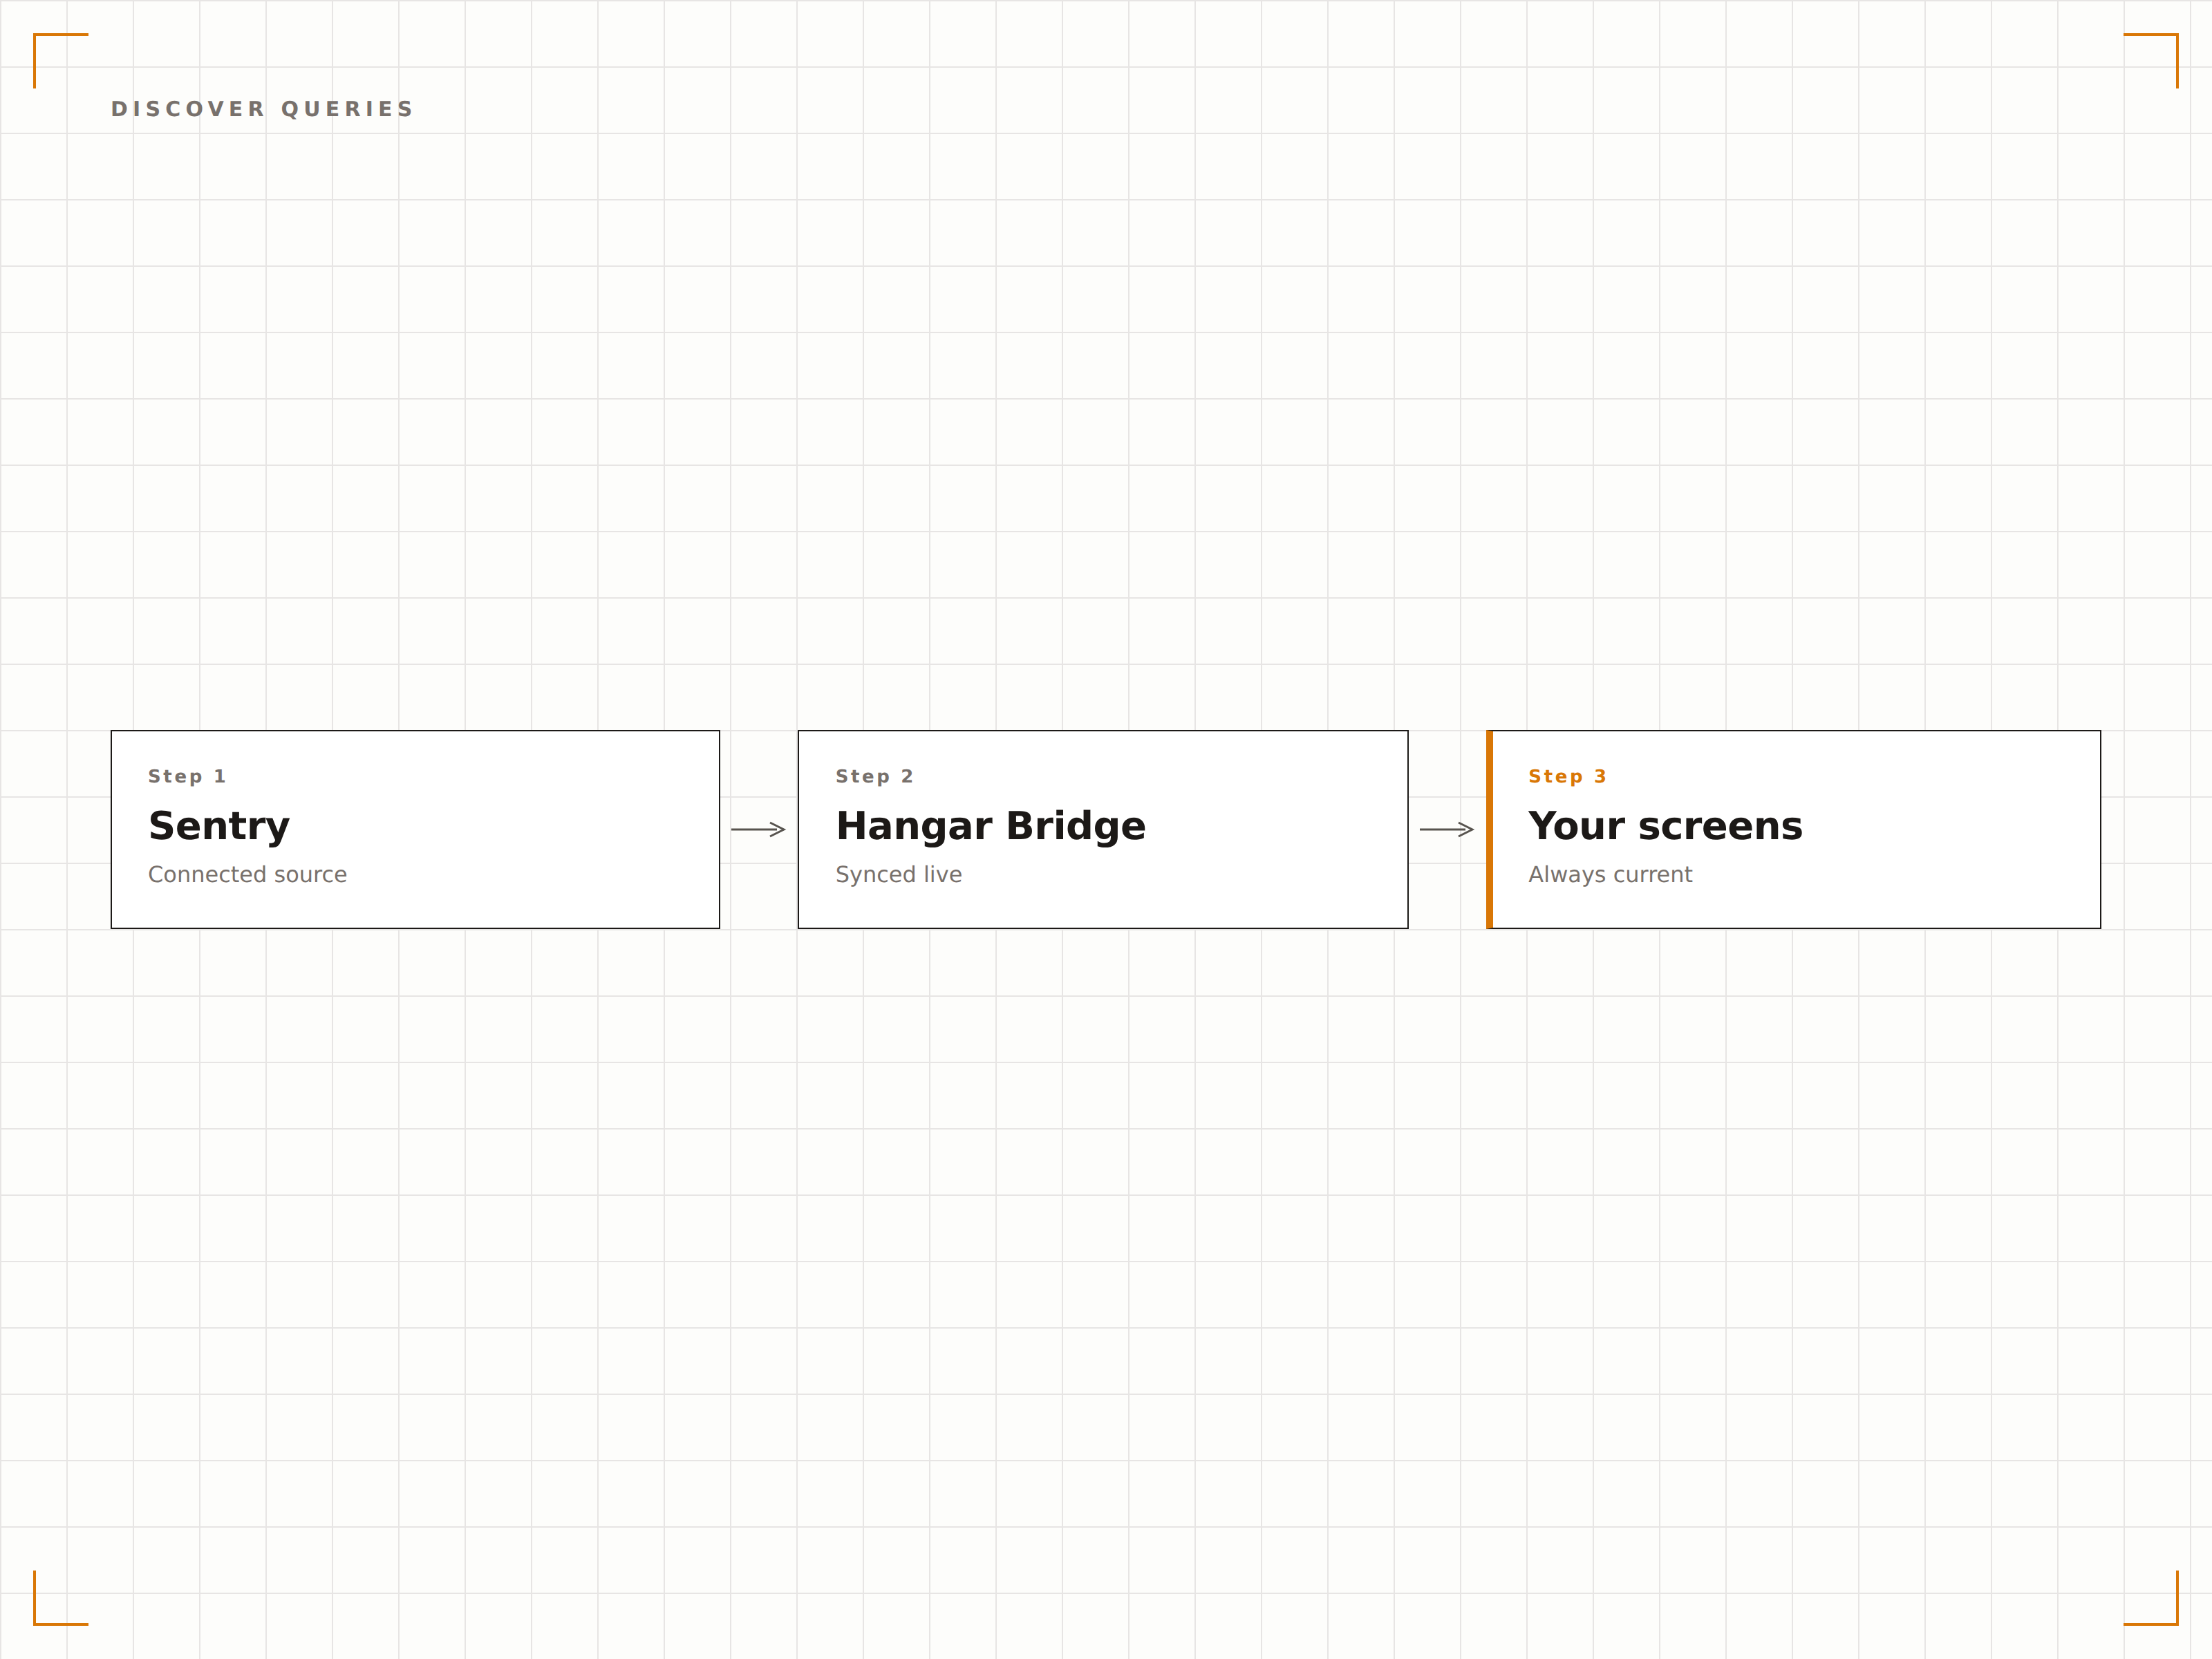
Analytics Personalizzate sugli Errori
Sentry Discover ti consente di creare query personalizzate sui tuoi dati di errore. Salva queste query come widget della dashboard e visualizzale sugli schermi di segnaletica digitale. Monitora tipologie specifiche di errori, conteggi di utenti coinvolti o metriche di performance con viste su misura.
Analytics personalizzate sugli errori, trasmesse al team.
Query Discover salvate sullo schermo
Filtri personalizzati per metriche e dimensioni
Viste dati flessibili per team diversi
Quattro passaggi verso schermi connessi.
Dalla configurazione ai contenuti live in minuti, non giorni.
Configura le Dashboard
Crea le tue dashboard e query Discover di Sentry con i widget e le metriche che desideri visualizzare.
Genera l'Accesso
Configura l'accesso autenticato per consentire a Hangar.Media di renderizzare le tue dashboard Sentry sui dispositivi player.
Imposta le Opzioni di Visualizzazione
Configura gli intervalli di aggiornamento, la modalità a schermo intero e la rotazione tra più viste Sentry.
Pubblica sugli Schermi
Assegna le dashboard Sentry agli schermi delle aree engineering e pubblica. I dati sugli errori sono visibili immediatamente.
Costruito per ogni settore.
Scopri come diversi settori utilizzano questa integrazione per ottenere risultati concreti.
Engineering Quality Board
Mostra conteggi degli errori, tassi di sessioni senza crash e salute delle release su uno schermo dedicato nell'area engineering per mantenere alta la consapevolezza della qualità in tutto il team.
FinancialPlatform Stability Monitor
Visualizza i tassi di errore e le metriche di performance delle API della piattaforma finanziaria sugli schermi nell'area del team di sviluppo per garantire la stabilità della piattaforma.
RetailCheckout Error Tracking
Monitora gli errori nel flusso di checkout, i problemi con i gateway di pagamento e i tassi di crash dell'app mobile sugli schermi durante i periodi di picco delle vendite.
EntertainmentStreaming Platform Health
Mostra i tassi di errore della piattaforma di streaming, gli episodi di buffering e i dati di performance lato client sugli schermi nell'area delle operazioni engineering.
Domande frequenti. Risposte dirette risposte.
Quali piani Sentry supportano la visualizzazione delle dashboard su segnaletica digitale?
Le dashboard e le query Discover di Sentry sono disponibili nei piani Team e Business. Il piano Developer gratuito ha funzionalità dashboard limitate. Verifica il tuo abbonamento Sentry per la disponibilità delle funzionalità dashboard.
Gli alert di Sentry possono attivare cambi di contenuto sulla segnaletica digitale?
Le dashboard di Sentry mostrano gli stati degli alert correnti e i trend degli errori sullo schermo. Per un alerting proattivo, puoi combinare la visualizzazione Sentry su segnaletica digitale con le funzionalità di alert di emergenza di Hangar.Media attivate tramite integrazioni webhook.
Con quale rapidità i nuovi errori appaiono sullo schermo di segnaletica digitale?
Hangar.Media aggiorna la dashboard di Sentry all'intervallo da te scelto, in genere ogni 30-60 secondi. I nuovi errori rilevati da Sentry appaiono sullo schermo di segnaletica digitale al successivo ciclo di aggiornamento.
Posso mostrare i dati Sentry di più progetti su un unico schermo?
Sì. Le dashboard di Sentry possono includere widget da più progetti e team. Crea una dashboard multi-progetto in Sentry e visualizzala sul tuo schermo di segnaletica digitale per una vista consolidata dell'error tracking.
Un prezzo. L'intera piattaforma.
Così pensiamo che la segnaletica digitale dovrebbe funzionare. Editor di contenuti, gestione degli schermi e oltre 200 integrazioni di app — tutto incluso fin dal primo giorno.